doi: 10.5477/cis/reis.191.129-140
Occupational Segregation by Sex:
Evolution and Situation in 2022
La segregación ocupacional por sexo. Evolución y situación en 2022
Marta Ibáñez and Aroa Tejero
|
Key words Census
|
Abstract The state of occupational segregation in Spain in 2022 has been updated, and its evolution and determinants over the past century have been analyzed. This study relies on the most commonly used indices in the literature: the Gini Index (and Lorenz curves), the Dissimilarity Index, and the Decomposed Dissimilarity Index (which neutralizes the structure effect), referring to census data for greater detail. The determinants of segregation are examined using multinomial regressions and are compared with marginal effects (EPA, 2011 and 2021). The findings indicate that segregation has not significantly decreased; the weight of occupations having the highest levels of segregation has increased, while it has decreased in occupations that were already becoming integrated. Additionally, an inverse relationship between income and education is confirmed in male –and female– dominated occupations. |
|
Palabras clave Censo
|
Resumen Se actualiza la situación para 2022 de la segregación ocupacional en España y se analiza su evolución y determinantes en el último siglo. Para ello se acude a los índices de mayor uso en la literatura: Índice de Gini (y curvas de Lorenz), Índice de Disimilaridad, e Índice de Disimilaridad Descompuesto (donde se neutraliza el efecto estructura), utilizando datos censales para asegurar la mayor desagregación. Los determinantes de la segregación se analizan con regresiones multinomiales y se comparan con efectos marginales (EPA, 2011 y 2021). Se concluye que la segregación no disminuye especialmente, pues aumenta el peso de las ocupaciones con segregación más extrema, mientras que disminuye en las ocupaciones que ya venían integrándose. Se comprueba también la relación contraria entre ingresos y educación en las ocupaciones masculinizadas y feminizadas. |
Citation
Ibáñez, Marta; Tejero, Aroa (2025). «Occupational Segregation by Sex: Evolution and Situation in 2022». Revista Española de Investigaciones Sociológicas, 191: 129-140. (doi: 10.5477/cis/reis.191.129-140)
Marta Ibáñez: Universidad de Oviedo | mibanez@uniovi.es
Aroa Tejero: Universidad de Oviedo | tejeroaroa@uniovi.es
Women make up approximately 48 % of the working population. Over the last century, more than two million women have entered the Spanish labor market (while the number of men has declined by slightly over eight hundred thousand)1. Furthermore, the data suggest that 70 % of all surveyed individuals believe that workplace inequality is lower than it was ten years ago2. However, the sexual divide in the workplace, and specifically, occupational segregation by gender continues to exist: half of all men work in occupations where there are less than 10 % women; and 25 % of all female workers is concentrated in ten of the 162 occupations included in the CNO-11 (2021 Census). Similarly, half of the population prefers a man to repair the boiler, washing machine or dishwasher, or to make renovations to the home. And almost half prefer a woman when looking for someone to care for a dependent person (CIS, 2023, Study 3428: 13).
Occupational segregation (and its correlate, the concentration of one sex in a few activities) is negative, not only because it reduces the life options of each gender, but also because it reveals inefficiencies in the allocation of jobs-workers3. And, above all, it is closely linked to the wage gap4.
The objective of this research note is to determine how occupational segregation has evolved in the 21st century. Based on prior studies (Ibáñez, 2008; Ibáñez and Vicente, 2017; Ibáñez and Vicente, 2020) three aspects of occupational segregation were selected to determine the situation in 2022 and its evolution over the last twenty years. First, Lorenz curves are used to show the distribution of employment between men and women over the last three census years (2001, 2011 and 2021) to see the evolution of the segregation. Second, this evolution is quantified in general and for each of the occupational categories, using the Decomposed Dissimilarity Index (DDI), which neutralizes the structural effect, revealing the degree to which the integration of the sexes increases/decreases in each of the occupations. Finally, the determinants explaining occupational segregation are analyzed. This reveals which characteristics are the most closely associated with feminized and masculinized occupations.
Evolution of occupational segregation in Spain
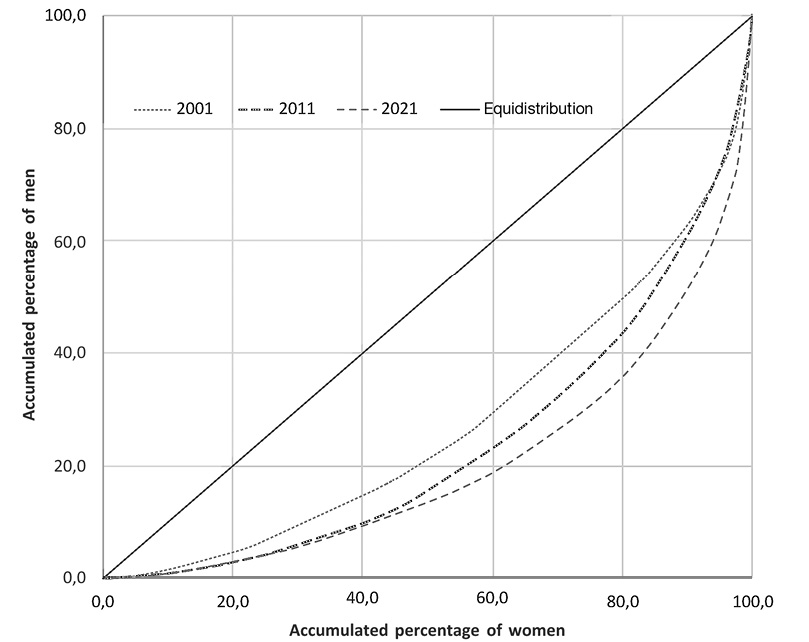
To analyze trends in occupational segregation, two well-known aggregate measures of inequality may be applied: the Lorenz curve and the Gini coefficient. On the one hand, the Lorenz curve indicates the cumulative percentage of women in occupations compared to the cumulative percentage of men (starting with those most segregated in their favor). And the same logic (inverse) is used for males. The diagonal line would symbolize a completely equal distribution of men and women in the different occupations. As the curve moves further away from the diagonal, occupational segregation between the genders becomes more pronounced.
As seen in Figure 1, occupational segregation has increased between 2001 and 2021: the Lorenz curve moves away from equidistribution in each of the years analyzed. This is explained by the continued strong segregation of the most feminized jobs, as 40 % of all employed women (horizontal point 40) were working in occupations in which 10 % were men in 2011 and 2021. But the segregation of the most masculinized jobs is also on the rise. In 2001, 50 % of all men (vertical point 50) were working in occupations where 20 % of women were employed. In 2021, only 10 % of the women were employed in these occupations. Overall, a total of 69 occupations account for half of the male workforce in which women make up only 10 %; and a total of 26 occupations account for 50 % of women, in which only 14 % of men are employed5.
On the other hand, this increase in segregation is also reflected in the Gini coefficients. Using the methodology proposed by Siltanen, Jarman, and Blackburn (1995), this index measures the area between the Lorenz curve and the diagonal as a fraction of the total area below the diagonal. When the curve coincides completely with the diagonal, the index reaches 0, indicating complete integration. Total inequality would be represented by a Gini coefficient of 1. As seen in Table 1, over these twenty years, occupational segregation measured by this instrument has also been on the rise: 0.32 in 2001; 0.37 in 2011; and 0.40 in 2021.
Table 1. Gini indices of occupational segregation by sex. Years 2001, 2011 and 2021
|
|
2001 |
2011 |
2021 |
|
GINI |
0.32 |
0.37 |
0.40 |
|
No. of occupations |
173 |
155 |
162 |
Source: Population census with 3-digit CNO. Author’s own creation.
To quantify general occupational segregation (and that of each specific occupation), two indicators are calculated. The most widely used measure of segregation may be the Dissimilarity Index (DI), which indicates the proportion of women (or men) who would have to change occupations in order to have an equal number of men and women (in each occupation)6. In 2021 (see Table 2), 44.5 % of women would have to change occupation to achieve equality in their distribution. This is a lower proportion than in previous years (48.8 % in 2001 and 47.1 % in 2021).
Table 2. Evolution of the Dissimilarity Indices (2001-2021)
|
|
2001 |
2011 |
2021 |
|
Dissimilarity index |
48.8 |
47.1 |
44.5 |
|
No. of occupations |
173 |
155 |
162 |
Source: Population census with 3-digit CNO. Author’s own creation.
However, the decline in the DI does not suggest that occupations, per se, are better integrated. The two major criticisms of this index are, on the one hand, its strong dependence on the number of occupations. And, on the other hand, there is the fact that, when analyzing the evolution of segregation, the so-called structural effect exists. In other words, it is sensitive to the relative weight of each occupation, which may vary over time. For example, the sharp decline of agricultural laborers (a highly masculinized occupation) in 2021 would lower the index, but it does not truly reflect that this occupation has become more inclusive. Furthermore, although the classification is the same (CNO-11), the 2011 census includes five occupations that do not appear in the 2021 census, and the 2021 census includes eleven occupations that did not appear in 2011 census.
To overcome these drawbacks, the Decomposed Dissimilarity Index (DDI) proposed by Blau, Simpson, and Anderson (1998) is used to control for this structural effect. Furthermore, since the occupations listed in both population censuses do not fully coincide, they are grouped into occupational categories7. Using the DDI, it is revealed that, in effect, these structural changes have had an influence on the segregation indices. The is evidenced in Table 38, which shows that the minor increase in segregation of the occupational categories between 2001 and 2011 (1.9) hid a true increase in segregation between sexes of 4.1 percentage points, offset by a decrease in the most segregated categories (structural change by category is shown in the Graph 2). Over the past ten years, segregation has decreased, but in reality, the difference between the sexes has only decreased by 2.2 points.
Over these twenty years, structural change has been quite significant, as seen in Graph 2, which reflects the evolution of the eleven categories during this century. The structural change in occupational categories follow familiar patterns: a sharp increase in professionals and, to a lesser extent, service workers; and a decrease in support technicians9 (occupations that perhaps have come to be considered professional) and qualified workers in the industry and assembly sectors. Furthermore, in 2021, fewer changes are expected, as the weight of elementary occupations increases again, while the number of business owners with employees and administrative workers decreases.
When looking at the changes in these categories according to sex, it can be seen that, in the last ten years, it is mainly men who have lost positions in the group of businessmen, while increasing in the group of elementary occupations. In the rest of the categories, the fluctuations over recent years are similar between the sexes. For example, office workers decrease, but it appears logical that women are the ones who do it the most, given their greater presence10.
To appreciate the net evolution of the segregation between men and women in the occupational categories (i.e., neutralizing the structure effect), the DDI is necessary (see Table 4). For example, when looking at the “Office Workers” category, the difference between 2001 and 2011 would be an increase in segregation of only 1.1 points in favor of women (9.3-8.2=1.1), but the change in segregation for 2011-2001 (neutralizing the structure effect) reveals an increase of 10.1 percentage points. In 2021, the reduction in the segregation index (7.2 – 9.3 = -2.1) reveals that during those 10 years, the contingent of employed people in this category has decreased (structure effect), but segregation (the weight of women in this category) has increased by 10.4 points.
Over these 20 years, the dynamics of segregation have varied significantly by category. Women have increased their presence in three categories: “Professionals, administrative workers and office employees” and “Service workers”. They continue to disappear from two others: “Skilled workers in industry and construction” and “Operators and assemblers”. Little by little, they are forming part of the service categories (“Entrepreneurs and executives”) and “Self-employed workers”. And finally, a change in trend is observed in “Elementary occupations”. Although segregation in favor of women has increased over the last ten years, it has not done so at the same rate as observed between 2001 and 2011.
Determinants of occupational segregation in Spain: Have they changed over the last decade?
The objective of this section is to analyze the determinants of occupational segregation in Spain and how they have changed between 2011 and 2022. Therefore, we aim to determine the specific characteristics that explain whether a person works in a feminized or masculinized occupation by estimating multinomial logistic regressions. This is one of the most appropriate techniques when considering that the relationship between occupational segregation and income/hour is not linear and takes on a U-shape in some research11. The results of the probabilities of working in female- or male-dominated occupations over the past ten years based on various characteristics are compared. An analysis of the evolution of each of the model’s factors is added based on the analysis of the Average Marginal Effects (AME). This is very useful for understanding the average effect of an independent variable on the probability of occurrence of the event of interest in the context of a logistic model. Therefore, it permits a comparison of the influence of the different factors over these ten years.
The sources used are the EPA microdata closest to each of the 2011 and 2021 Censuses (EPA11 and EPA22). The dependent variable measures occupational segregation, grouping these occupations into three large groups: male-dominated, female-dominated, and mixed. For this grouping, male-dominated groups are defined as those having 20 % more men than the weight of men in the workforce as a whole, and the same for women12. The division between these three categories of the dependent variable has been made from the census data, thus avoiding sampling errors and allowing work with the three-digit CNO-11.
A comparison of the dependent variable with the 2011 results (Ibáñez and Vicente, 2020) reveals that the number of workers in mixed occupations has increased (36 % compared to 45 %); the number of individuals in male-dominated occupations has decreased (30.8 % compared to 24.8 %); while female-dominated occupations continue to have a similar number of workers (see Table 5). This decrease in the weight of segregated occupations is due to the tendency towards polarization of the phenomenon, as observed in the Lorenz curves. The most segregated occupations increase their segregation, while those that were on the borders of mixed occupations increase their integration.
Independent variables include sociodemographic characteristics (age, sex and education level), variables that reflect job rewards (salary decile, occupational category, type of contract, type of working day, number of months in the company and whether it involves supervisory work), company characteristics (size, public/private sector and branch of activity) and the availability of work hours involved in the jobs (how often do you work from home, on Saturdays, Sundays, in the afternoons, at night, in shifts, whether you work overtime and whether you would like to work more hours)13. The models were estimated for all employees and for those working only full-time. The results are very similar, reflecting the robustness of the results14. Regarding the most interesting effects, the following are mentioned: 1) the models for full-time workers in order to observe the probability of working in occupations that are segregated by level of education and position in the monthly wage distribution, according to deciles (see Graph 3) and 2) the comparison of the marginal effects of both years.
Probabilities of the regression model according to level of education and salary (ceteris paribus the other variables)
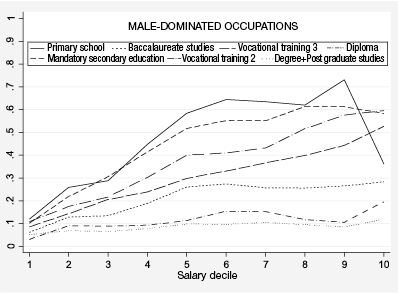
The likelihood of working in male-dominated occupations increases as educational attainment decreases. In other words, those least likely to work in male-dominated occupations are those with undergraduate degrees and higher, followed by those with university diplomas or degrees, baccalaureate degrees, vocational training (FP3), vocational training (FP2), and finally those with compulsory secondary education (ESO) and primary education, and less education. But of greater interest is the slope of the curve (quite linear, in fact) which indicates that, in general, as salaries increase in each group of studies, the probability of working in a male-dominated occupation also increases. Note that this increase is high (and sustained) especially among workers with vocational training, while it is very low in male-dominated occupations where university graduates work. In other words, people with lower education levels are interested in working in male-dominated occupations, as they provide higher earnings.
The probabilities of working in female-dominated occupations according to income and education level have completely different profiles. First, the slopes of all the curves run in the opposite direction, since regardless of education level, as wages increase in each group, the probability of working in a female-dominated occupation decreases. The other major difference is that these probabilities are not ordered by education level. In ascending order: primary education, compulsory secondary education, undergraduate and postgraduate studies, high school, vocational training (FP3) and vocational training (FP2) are very similar, and, above all, earning a diploma.
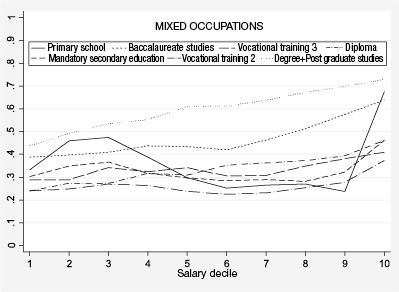
Finally, the graph of probabilities of working in mixed occupations according to income and education level reveals that the probability of working in mixed occupations is also not ordered by education. The order from highest to lowest is as follows: having a university degree or higher, having a bachelor’s degree (very similar for those with vocational training (FP2), vocational training (FP3), and compulsory secondary education), and, finally, university diplomas. The probability of having the first qualifications increase as wages increase, while the rest maintain a horizontal slope, all in a linear dynamic. For those with primary school education, the probabilities of working in an integrated occupation have an irregular profile.
Comparison of Averages of Marginal Effects (AME) 2011-2021
AMEs are used to observe changes in the influence of the set of variables in the model on the probability of working in a feminized or masculinized occupation over the last ten years. These are necessary because logistic regression models reflect a certain degree of unobserved heterogeneity, which prevents direct comparison of odds ratios (or logarithms of the odds ratios) between groups within the same sample (in our case, male-dominated versus female-dominated occupations) or between different points in time (2011 and 2022), even if the models share the same independent variables. Furthermore, this comparison is not possible when the models contain different independent variables within the same sample (Mood, 2010: 67-68; 2017: 8-9 in Ballesteros, 2018). In short, the AME provides a summary measure of the average change in the dependent variable (in our case, being in a male-dominated profession versus a mixed occupation, holding female-dominant professions constant and vice versa) associated with a unit change in an independent variable, while holding all other variables constant. Therefore, it permits comparison-making. As with other results in this research note, the graphs have been transferred to the RUO, including only a selection of the characteristics that have remained the same over these ten years (the changes may be observed in the graphs in the repository).
Female-dominated occupations continue to have fewer employment rewards, as higher salaries, a job with a fixed-term contract, or one that involves supervisory work reduce the likelihood of being employed in a feminized occupation. Meanwhile, male-dominated occupations receive higher salaries, even though they are more associated with skilled and unskilled work, or with support and administrative work.
Company size indicates that working in micro-enterprises (less than ten workers) or medium-sized enterprises (between twenty and 249) decreases the likelihood of being in a female-dominated occupation. Furthermore, working in the public sector is also related to working in female-dominated occupations, an influence that increases in 2022. Similarly, working in the public sector decreases the likelihood of being in a male-dominated occupation.
Finally, there are variables measuring the type of availability: working more than half of all Saturdays and in shifts is positively associated with female-dominated occupations. Working more than half of all Sundays, in the afternoon (occasionally), and at night are less likely to be in female-dominated occupation. In the case of male-dominated occupations, this consistency only exists among those who work at home or more than half of all Saturdays, who are more and less likely to be in these occupations, respectively.
The main objective of this research note is to update the analysis of occupational segregation in Spain in terms of the evolution of the phenomenon and its determinants. It has revealed that, contrary to the general belief that labor markets are increasingly egalitarian, occupational segregation by gender continues to structure our employment opportunities and, therefore, our lives15.
There are many ways to analyze segregation, and the different indicators reveal different aspects of the phenomenon. On the one hand, it has been found that, although the most general indicators may decrease slightly (for example, the Dissimilarity Index, the most widely used), when the effect of changes in the occupational structure is isolated, the trend disappears. In other words, changes in these rates are more the product of increases or decreases in these segregated occupations as opposed to the coexistence of both sexes in jobs. Furthermore, in terms of occupational category, the trends have remained the same over the last twenty years. Women have increased their presence among technicians and professionals, especially among service workers and office employees, and their presence has decreased even further among operators and assemblers, and especially among industrial and construction workers.
On the other hand, considering the internal dynamics of the phenomenon, and the distribution of segregation along a continuum (the Lorenz curve), it is observed that those occupations that have always been more segregated have increased their segregation over the past twenty years, while those that were on the borders of mixed occupations have increased their integration.
Finally, regarding the factors associated with different occupations, the most interesting relationship exists between education level and income (holding all other factors constant), since male-dominated occupations are more likely to provide higher salaries. In fact, the best option for those with lower education levels is to choose these occupations because they offer higher salaries. Similarly, however, female-dominated occupations are less likely to provide higher salaries. In fact, not even education level is capable of neutralizing this relationship.
Ballesteros, Matías S. (2018). Promedio de los efectos marginales e interacciones en las regresiones logísticas binarias. Working Document. Available at: https://www.aacademica.org/matias.salvador.ballesteros/43.pdf, access January 29, 2025.
Blau, Francine D.; Simpson, Patricia and Anderson, Deborah (1998). “Continuing Progress? Trends in Occupational Segregation in the United States over the 1970s and 1980s”. Feminist economics, 4(3): 29-71. doi: 10.1080/135457098338301
Buligescu, Bianca; Borghans, Lex and Fouarge, Didier (2020). “The Impact of Occupational Segregation on Occupational Gender Pay Gap in the European Union”. Journal of Community Positive Practices, 4: 86-111. doi: 10.35782/JCPP.2020.4.05
CIS (2023). Percepción sobre la igualdad entre hombres y mujeres y estereotipos de género. January. Study 3428. Madrid: Centro de Investigaciones Sociológicas. Available at: https://www.cis.es/-/disponible-el-estudio-3428-percepciones-sobre-la-igualdad-entre-hombres-y-mujeres-y-estereotipos-de-genero-, access January 29, 2025.
Eurofound and European Commission Joint Research Centre (2021). European Jobs Monitor 2021: Gender Gaps and the Employment Structure, European Jobs Monitor series. Luxembourg: Publications Office of the European Union.
Goldin, Claudia (2024). Carrera y familia. El largo viaje de las mujeres hacia la igualdad. Madrid: Taurus.
Ibáñez, Marta (2008). “La segregación ocupacional por sexo a examen. Características personales, de los puestos y de las empresas asociadas a las ocupaciones masculinas y femeninas”. Revista Española de Investigaciones Sociológicas, 123: 87-122. doi: 10.5477/cis/reis.123.87
Ibáñez, Marta and Vicente, María R. (2017). Conceptos, medidas y evolución de la segregación laboral. In: M. Ibáñez (dir.). Mujeres en mundos de hombres: la segregación ocupacional a través del estudio de casos (pp. 15-33). Madrid: Centro de Investigaciones Sociológicas.
Ibáñez, Marta and Vicente, María R. (2020). “La segregación ocupacional por sexo. Evolución en España 2001-2011: diez años de caminar sin avanzar”. Revista Española de Investigaciones Sociológicas, 171: 43-62. doi: 10.5477/cis/reis.171.43
INE (2001). Censo de población y vivienda 2001. Available at: https://www.ine.es/dyngs/INEbase/es/operacion.htm?c=Estadistica_C&cid=1254736177108&menu=resultados&idp=1254735572981, access March 15, 2023.
INE (2011). Censo de población y vivienda 2011. Available at: https://www.ine.es/dyngs/INEbase/es/operacion.htm?c=Estadistica_C&cid=1254736177108&menu=resultados&idp=1254735572981, access March 15, 2023.
INE (2021). Censo de población y vivienda 2021. Available at: https://www.ine.es/dyngs/INEbase/es/operacion.htm?c=Estadistica_C&cid=1254736177108&menu=resultados&idp=1254735572981, access March 15, 2023.
Karmel, Tom and MacLachlan, Maurine (1988). “Occupational Sex Segregation— Increasing or Decreasing?”. Economic Record, 64: 187-195. doi: 10.1111/j.1475-4932.1988.tb02057.x
Magnusson, Charlotta (2013). “More Women, Lower Pay? Occupational Sex Composition, Wages and Wage Growth”. Acta Sociológica, 56(3): 227-245. doi: 10.1177/0001699313484480
Mood, Carina (2010). “Logistic Regression: Why We Cannot Do What We Think We Can Do, and What We Can Do about It”. European Sociological Review, 26(1): 67-82. doi: 10.1093/esr/jcp006
Perales, Francisco (2013). “Occupational Sex-segregation, Specialized Human Capital and Wages: Evidence from Britain”. Work, Employment and Society, 27(4): 600-620. doi: 10.1177/0950017012460305
Rytina, Nancy F. (1981). “Occupational Segregation and Earnings Differences by Sex”. Monthly Labor Review, 104(1): 49-53.
Siltanen, Janet; Jarman, Jennifer and Blackburn, Robert M. (1995). Gender Inequality in the Labour Market: Occupational Concentration and Segregation. Geneva: International Labour Organization (ILO).
Sokoloff, Natalie J. (1992). Black Women and White Women in the Professions: Occupational Segregation by Race and Gender 19601980. New York: Routledge.
1 Census 2001, 2021, National Statistics Institute (INE).
2 Results of the question “And as compared to the situation ten years ago, do you believe that inequality between men and women is greater today, the same or less?”. 70.6 % of the surveyed individuals believe that it is lower (P5, Study 3428, CIS 2023).
3 As in March of 2024, when access to the transport sector in Spain was facilitated for Moroccan drivers. Available at: https://acortar.link/uDH2ah
4 In the US, it accounts for one third of the gap (Goldin, 2024: 217). In Europe, comparing ten countries and ninety-three occupations, the female salary decreased as the percentage of women in the occupation increased (Buligescu et al., 2020).
5 The data are presented in Table A1 of the appendix published by the University of Oviedo Repository (RUO). Available at: https://digibuo.uniovi.es/dspace/handle/10651/72763
6 One explanation of the distinct indices is found in Ibáñez and Vicente, 2017, pp. 359 et seq.
7 The ten categories used by the INE (INE, 2012) have been included, as well as ownership, bringing us closer to the idea of social class. On the one hand, the group of services has been divided into 1a “Entrepreneurs with employees” and 1b “Directors and managers”. And, on the other hand, the group A “Self-employed” has been added.
8 After creating the DDI based on the occupational categories, the results are lower, since every index is very dependent on the number of occupations collected (see examples in Karmel and Maclachlan, 1988: 189).
9 Also because some occupations catalogued in the CNO-94 as Technical (beginning with 3 in the 4-digit classification) are transferred to Professional (beginning with 2) in the CNO-11. See Correspondencias teóricas para fines estadísticos. Available at: https://www.ine.es/dyngs/INEbase/es/operacion.htm?c=Estadistica_C&cid=1254736177033&menu=ultiDatos&idp=1254735976614
10 The evolution of occupational categories between 2001 and 2021 by sex is shown in Chart A1 of the RUO. Available at: https://digibuo.uniovi.es/dspace/handle/10651/72763
11 There are contrasts in the literature: Perales (2010), with British survey data, observes an inverted U-shaped relationship, as does Magnusson (2013) with Swedish register data. Buligescu et al. (2020), aggregating data from ten countries and with the European EES, qualify these results, concluding in their final model in a U-shape, where men earn relatively high wages in female-dominated occupations and women earn relatively high wages in male-dominated occupations.
12 This is the most conservative option from the literature, followed by that of Rytina (1981) and Sokoloff (1992).
13 A more detailed description of the independent variables is available in Table A.2, in the file “Anexos.docx” in the RUO. There is also a comparison of data from ten years ago available at: https://digibuo.uniovi.es/dspace/handle/10651/72763
14 The results of the multinomial regressions and the calculation of the PEMs for the years 2011 and 2022 can be found in the file “Anexo Resultados logit.xlsx” in the RUO. Available at: https://digibuo.uniovi.es/dspace/handle/10651/72763
15 Results consistent with those shown by Eurofound (2021) for the rest of Europe.
Graph 1. Lorenz curve of occupations according to their proportion of women and men
Fuente: Censos de Población con las CNO a 3 dígitos. Elaboración propia.
Source: Population census, 2001, 2011, 2021. INE. Author’s own creation.
Table 3. Evolution of the Index of Dissimilarity Decomposed by Occupational Categories
|
2001 |
2011 |
Dif. 2001-2011 |
2021 |
Dif. 2011-2021 |
|
|
Dissimilarity Index |
30.5 |
32.4 |
1.9 |
28.1 |
-4.3 |
|
Decomposition |
|||||
|
Structure effect of the occupations |
-2.5 |
-1.8 |
|||
|
Integration effect of the occupations |
|
|
4.1 |
|
-2.2 |
Note: The residual component has been eliminated, since it does not provide information to the analysis.
Source: Years 2001 and 2011 in Ibáñez and Vicente (2017: 24). Year 2021, Spanish National Statistics Institute (INE) Census. Author’s own creation.
Graph 2. Evolution of occupational categories from 2001-2021. Percentages of the total for each year
Source: Population census with 3-digit CNO. Author’s own creation.
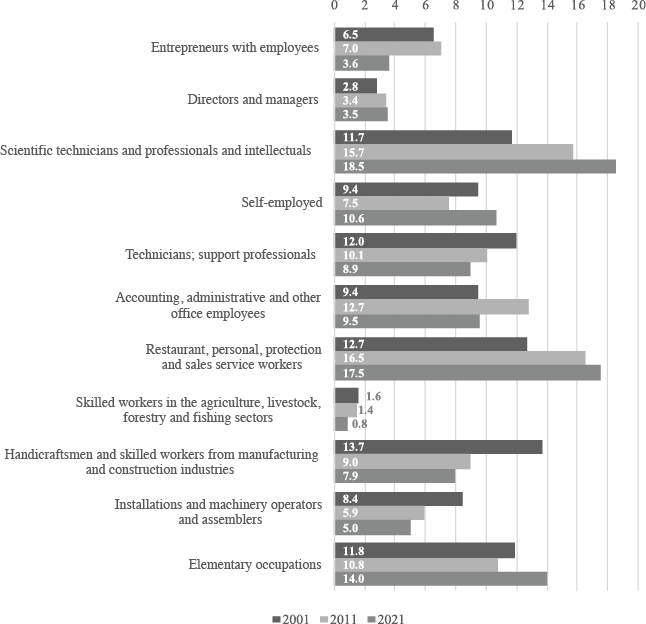
Table 4. Evolution of the differences in the proportions of women and men employed in each occupational category, neutralizing the structural effect
|
Categories |
Fi/F-Mi/M |
Fi/F-Mi/M |
Segregation variation (neutralizing the structure effect) |
Fi/F-Mi/M |
Segregation variation (neutralizing the structure effect) |
|
2001 |
2011 |
2011-2001 |
2021 |
2021-2011 |
|
|
Entrepreneurs with employees |
-3.8 |
-4.3 |
-2.2 |
-1.2 |
-1.9 |
|
Directors and managers |
-1.3 |
-1.9 |
-0.8 |
-2.0 |
-1.8 |
|
Technicians and professionals |
6.9 |
7.7 |
9.6 |
8.9 |
8.3 |
|
Self-employed |
-3.0 |
-3.4 |
-1.6 |
-4.0 |
-2.5 |
|
Technicians; support professionals |
-0.1 |
-3.6 |
-0.8 |
-1.7 |
-1.5 |
|
Office employees |
8.2 |
9.3 |
10.1 |
7.2 |
10.4 |
|
Service workers |
11.2 |
9.5 |
11.6 |
9.0 |
9.3 |
|
Skilled primary sector workers |
-1.3 |
-1.2 |
-0.9 |
-0.9 |
-1.5 |
|
Industry and construction workers |
-15.3 |
-11.2 |
-13.8 |
-11.2 |
-12.3 |
|
Operators and assemblers |
-5.7 |
-6.8 |
-7.6 |
-7.1 |
-8.1 |
|
Elementary occupations |
4.2 |
5.9 |
10.3 |
2.9 |
2.7 |
Note: To make the differences comparable over time, the proportions of employed women and men have been weighted by the impact of these occupations on the total female and male employment in the previous census, respectively. M/F gap if Ni weight in total M/F constant.
Source: Population census. Author’s own creation.
Table 5. Classification of male-dominated, female-dominated and neutral occupations. Worker percentages
|
Census 21 employed (52.4 v/47.6 m) |
EPA 22 employed (53,7 v/46,3 m) |
EPA 22 salaried workers (50,1/49,9) |
EPA 22 No. of occupations |
|
|
Male-dominated |
24.8 |
26.3 |
26.2 |
37.3 |
|
Female-dominated occupations |
30.4 |
28.9 |
32.5 |
15.7 |
|
Mixed occupations |
44.9 |
44.8 |
41.3 |
47.0 |
|
TOTAL |
100 17,617,758 |
100 Population 20,390,582 Sample 34,022 |
100 Population 17,155,618 Sample 28,310 |
100 (N=166) |
Note: The dependent variable is calculated over the proportions of men and women in 2011 (55 men/45 women) and 2021 (52.4 men/47.6 women). Segregated occupations are those rising twenty percentage points above these proportions.
Source: Author’s own creation based on the Spanish National Statistics Institute (INE) (2021).
Graph 3. Probability of working in a female-dominated, male-dominated, or mixed occupation according to education level and monthly salary decile (EPA2022)
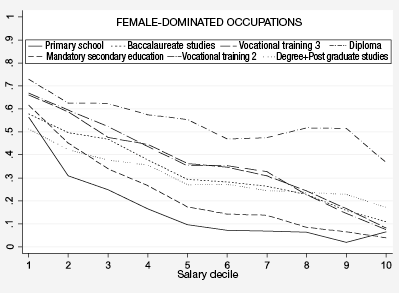
Source: Author’s own creation.
RECEPTION: June 6, 2024
REVIEW: October 18, 2024
ACCEPTANCE: December 2, 2024