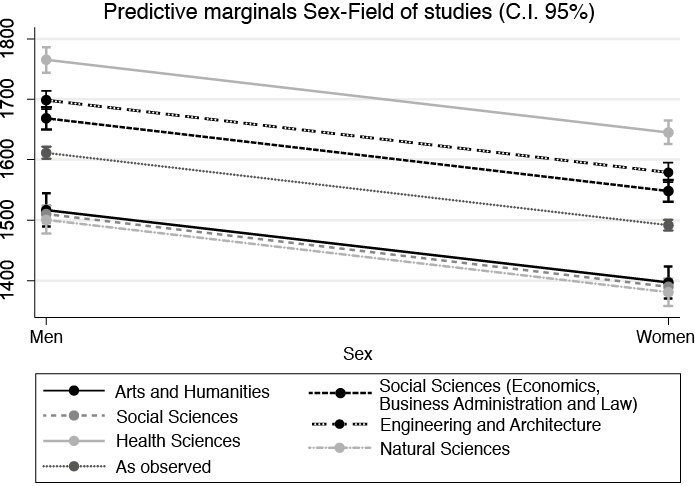
Graph 1. Linear prediction of income for men and women by field of study
Source: Prepared by the authors based on data from EILU, 2019.
doi:10.5477/cis/reis.192.125-148
A Multi-Factor Analysis of Graduate Entry
into the Labour Market: System Equity
and the Persistence of Gender Inequalities
Análisis multifactorial de la inserción laboral de personas graduadas: equidad del sistema y persistencia de desigualdades de género
Juan Ramón Jiménez-García and Sandra Fachelli
|
Key words Background Inequalities
|
Abstract This article analyses the entry of university graduates into the labour market, focusing on their earnings five years after graduation, and considering factors such as field of study, type of university, technological skills, language skills, social background, gender, age and autonomous community. The paper presents findings on earnings based on microdata from the Encuesta de inserción laboral de titulados universitarios (EILU) de 2019 (2019 Survey on Graduate Entry into the Labour Market). We highlight the role of university education in mitigating socio-economic differences measured by the educational level of parents. This underscores the importance of a higher education system that facilitates access to and completion of university studies for students from working-class backgrounds. A free education would increase access to and completion of studies for vulnerable groups. The study shows the persistence of gender inequalities in the graduate labour market. |
|
Palabras clave Desigualdades de origen
|
Resumen Este artículo analiza la inserción laboral de graduados universitarios, enfocándose en los ingresos cinco años después de la obtención del título, considerando factores como campo de estudio, tipo de universidad, habilidades tecnológicas, idiomas, origen social, género, edad y comunidad autónoma. Utilizando microdatos de la Encuesta de inserción laboral de titulados universitarios de 2019, se presentan resultados sobre los ingresos. Destacamos cómo la educación universitaria puede mitigar diferencias socioeconómicas medidas por el nivel educativo de los padres, respaldando la importancia de un sistema educativo superior que permita a hijos de clases trabajadoras acceder y completar la formación universitaria. La gratuidad del sistema educativo aumentaría el acceso y la finalización de estudios en colectivos vulnerables. El estudio evidencia la persistencia de desigualdades de género en el mercado laboral de graduados. |
Citation
Jiménez-García, Juan Ramón; Fachelli, Sandra (2025). “A Multi-factor Analysis of Graduate Entry into the Labour Market: System Equity and the Persistence of Gender Inequalities”. Revista Española de Investigaciones Sociológicas, 192: 125-148. (doi: 10.5477/cis/reis.192.125-148)
Juan Ramón Jiménez-García: Universitat Pompeu Fabra | juanramon.jimenez@upf.edu
Sandra Fachelli: Universidad Pablo de Olavide | sfachelli@upo.es
Introduction1
University education is a key factor in the labour market, especially for those with higher levels of education (Ballarino, Bernardi and Panichella, 2013). Spain has become an EU leader in educational expansion over the last four decades, which has led to a remarkable increase in female participation in higher education (Merino and García, 2007). However, gender inequalities persist in the choice of university courses studied, with a greater presence of men in degrees that lead to more highly paid careers. Although higher education has often been associated with better job opportunities and has the potential to attenuate class differences (Fachelli, Torrents and Navarro-Cendejas, 2014b), the gender pay gap persists (Jiménez-García, 2020).
The main objective of this article is to analyse the entry of university graduates into the labour market, focusing on their earnings five years after graduation.
The specific objectives concentrate on the factors that influence graduate entry into the labour market in Spain. The aim is to examine how social background affects employment income, assess the impact of the field of study and analyse differences between degrees, using appropriate statistical analysis techniques: a multiple linear regression for the main analysis, and logistic and ordinal regressions to increase the robustness of the results.
The study also assesses gender inequalities in graduate earnings, exploring the wage gap compared to the labour market at large (not only focusing on university graduates). This helps to understand whether higher education reduces the gender pay gap. The influence of university type, technological skills and language proficiency on income is also analysed, controlling for sociodemographic factors, with the aim of providing a thorough view of the elements shaping the labour market entry of graduates in Spain and their relationship with social and gender inequalities.
Microdata from the Encuesta de inserción laboral de titulados universitarios (EILU) de 2019 del Instituto Nacional de Estadística (INE) (2019 Survey on Graduate Entry into Labour Market Entry by the National Statistics Institute) are analysed. These data provide detailed information on the aspects described above.
The article begins with a review of the literature on graduate entry into the labour market, highlighting the importance of social background and aspects of horizontal inequality. The research design is then explained, followed by the results on graduate earnings, the conclusions, the limitations and some possible methodological improvements, as well as the advances and advantages compared to previous studies.
Literature Review
Multiple approaches can be taken to the analysis of graduate entry into the labour market, including economic aspects such as the rate of return and the match between education and work. The rate of return is a profitability measure that assesses investment in education (Carnoy, 2006). From a sociological perspective, these results become more relevant when social background is considered.
Sociology has analysed the relationship between the occupation and education of parents and their offspring. Classical theories of educational attainment have shown the influence that parental occupational and educational status has on the attainment of their children (Duncan, 1966; Blau and Duncan, 1967 or Duncan and Featherman, 1972).
Educational attainment has been linked to persistent inequalities that act as a stratification mechanism (Warren and Hauser, 2002; Shavit, Yaish and Bar-Haim, 2007). Seminal studies by Hout (1984, 1988) in the United States found that obtaining a university degree erased the disadvantages linked to a lower social background. This relationship has also been observed in some European countries (Vallet, 2005; Breen and Luijkx, 2004).
In Spain, the influence of social background has been seen to weaken as higher levels of education are attained, particularly university degrees (Fachelli and Jordi, 2014a; Fachelli, Torrents and Navarro-Cendejas, 2014b). The diversity of social backgrounds among university students has been noted (Carabaña, 2005; Subirats, 2011; Fachelli, 2011), although upper-class parents are proportionally more likely to send their children to university (Fachelli and Planas, 2011; Torrents, 2012). Educational expansion in Spain has been dramatic in recent decades (Martínez-García 2017; Ortiz and Rodríguez-Menés, 2016), with more than half of degree students coming from households whose parents did not have a university education (EILU, 2019). This process has had an impact on reducing educational inequalities, especially for women (Martínez-García, 2007), although it has not affected the pre-university levels of the 1970 cohorts (Martínez-García and Merino, 2011).
Several studies have shown that increased investment in education has positive effects on employability (Jiménez-García, 2018; Schröder and Ganzeboom, 2014; Wolbers, 2000, 2007) and reduces the likelihood of unemployment and its consequences (Ortiz and Wolbers, 2011). Recent research has confirmed that increasing education investment ensures better job opportunities (Jiménez-García, 2020) and decreases the chances of unemployment (Schmelzer Veira, 2016; Martínez-Pastor, 2020).
These overall results take on new nuances in the light of horizontal differentiation processes. There has been a significant advancement of women in universities, which has played a leading role in the democratisation of higher education (Fachelli and Planas, 2011; Jiménez-García, 2020). However, patterns of inequality persist, as seen in labour market entry, where wage gaps between men and women remain even when they hold the same degrees. Here the great unequaliser —the labour market— once again comes into play and may even counteract the effects of university education.
Other elements of horizontal inequality include institutional aspects (a public or a private university), university degrees, and skills that are highly valued in the labour market, such as Information and Communications Technology (ICT) and language skills. Degree choice involves aspects of gender and social background. The selection of either a public or a private university, albeit not perfectly correlated with socio-economic status, operates as an access filter. Gambetta (1987) warned of the need to distinguish between the influence of economic and cultural factors according to social class.
The choice of university degrees is determined by gender and social background. Some authors have attributed occupational inequalities to the fields of study chosen by men and women, respectively (Ballarino and Bratti, 2009; Ochsenfeld, 2014), while others have emphasised men’s tendency to study degrees associated with higher wages and status (Benson, 2015; Srivastava and Sherman, 2015; Reisel, 2013). Schröder and Ganzeboom (2014), for their part, found that longer degrees were more often studied by men than by women. Gender has been considered a key factor in employment inequalities (Barone, 2011; Charles and Bradley, 2009; Jiménez-García, 2020). Social background also influences labour market entry through the differential access to information and social capital (Hansen, 2001; Opheim, 2007), as well as parental expectations (Breen and Goldthorpe, 1997; Goldthorpe, 2007), which push offspring to surpass the level achieved by their parents.
ICT and language skills, as well as regional differences, play a significant role in the relationship between gender, social class and graduate earnings, amplifying or mitigating existing inequalities. Digital and language skills are increasingly in demand due to digitalisation and globalisation processes, and can potentially influence job and wage opportunities, benefiting those with better access to training and education in these areas (Dewyer, 2013; Manning, 2004).
In this sense, persistent regional inequalities, despite convergence in university efficiency (Agasisti and Pérez-Esparrels, 2010; Cabrera-Rodríguez, 2013), may have different effects on graduates depending on their respective social classes and genders, contributing to maintaining or exacerbating wage gaps.
Our research questions were: what are the main differences in graduate entry into the labour market; and to what extent are wage inequalities among graduates due to social background or gender, or to other factors?
Based on these questions, the hypotheses were as follows: university education is expected to mitigate socio-economic background inequalities (approximated by the educational level of parents). The field of study will significantly influence graduate earnings, with graduates in engineering, architecture, health care and applied social sciences being better positioned in terms of pay. Gender inequalities in income are expected to persist.
The reported “current net monthly salary” was used as a proxy to analyse labour market entry and explore inequalities among university graduates. Table 1 below provides context by comparing the employment status of graduates with that of the overall population.
Comparing the results in Table 1, graduates’ employment rate was found to be 35 % higher, their unemployment rate was 6.4 % lower and their inactivity rate was 29 % lower than that of the general population. Gender differences were also much smaller among graduates than among the rest of the population.
It is also important to note that the social background of those who graduated five years ago was very similar for all categories analysed. For those in employment, the percentage was similar to the average for those from low and high social backgrounds and slightly higher for those from middle-level backgrounds. Among unemployed people, it was somewhat higher for those from a low social background. Finally, the percentage was slightly higher for those from higher origins among inactive people. The impact of the social background of graduates will be analysed in detail in the results section.
The data presented here are relevant, as we are not looking at all graduates, but only at those who left university five years ago. Although 43.6 % of the graduates had worked during their degree, others went on to study for a Master’s degree or other qualifications (23.4 %), which means that we are measuring the labour market entry level of a group of young people made up of more than 50 % of people under 30 years of age.
Research design
and methodology
As the primary aim of this article is to examine the influence of social background, socio-demographic variables and individual and contextual factors on graduates’ earnings, a dependent variable was constructed to reflect their earnings five years after graduation. The original nine-category categorical wage variable was used, thus creating a continuous variable where the mean values of each category could be employed for linear regressions. Both a binary variable which divided the population according to high or low income (above or below 1500 euros per month) and the original variable were also used to corroborate the main results of the analysis.
To discover which factors influenced graduate earnings, a number of independent variables were included: sex, age, social class background (as measured by parents’ educational dominance), field of study, type of university, ICT proficiency, language skills, type of working hours and geographical region of work in 2019. Self-employed people accounted for 8.6 % of the graduates, which meant that more than 90 % of them were salaried employees.
Firstly, the sex, age, type of university, type of working hours and ICT proficiency variables were similar to those presented in the database. They recorded whether the interviewees were over or under thirty years old at the time of the interview; whether they had studied at public or private universities; and whether they had a basic, advanced or expert ICT level in at the time of the interview, as well as their sex. While it would be preferable to have access to exact age data, this was only available as a binary variable in the database.
Secondly, since the Survey lacked a question on parental occupation, the social class background was determined by educational dominance, considering parental highest educational attainment. A 3-level variable was created: 1) both parents with a low level of education; 2) at least one parent with an intermediate level of education; and 3) at least one parent with a university education.
Thirdly, the field of study was divided into six categories, separating social sciences (48 % of the sample) into two groups, due to salary and occupational differences observed among graduates from degrees such as Law, Economics and Business Management and Administration (Fachelli and Jordi, 2014a). Thus, one more category was used than in the original variable. The original “degree” variable was used to make this division. This variable included a total of 101 university degrees.
Fourthly, the language skills variable was converted into three categories: 1) native language only; 2) one foreign language; and 3) two or more foreign languages. For this variable, we selected proficiency in foreign languages and not proficiency in several co-official Spanish languages.
Fifthly, a variable recording region of residence was generated based on Eurostat’s Nomenclature of Territorial Units for Statistics (NUTS) classification (2024), grouping the autonomous communities into eight categories, to allow comparisons at the European level. This approach seeks to measure the impact of higher education on income. To do so, it is more relevant to consider the region in which individuals reside and work at the time of the Survey, rather than the region where they studied. The NUTS classification groups regions into eight categories, which include both large geographical areas and territories with a population of between 800 000 and three million. The categories are as follows: Northwest region (Galicia, Asturias and Cantabria), Northeast region (Euskadi, Navarre, La Rioja and Aragon), Madrid, Central region (Castilla y León, Castilla-La Mancha and Extremadura), Eastern region (Catalonia, Valencia and the Balearic Islands), Southern region (Andalusia, Murcia, Ceuta and Melilla), Canary Islands region and, finally, a category called Overseas, which groups together people who reside outside Spain.
Data
This article analysed the microdata from the Survey on Graduate Entry into Labour Market Insertion Entry (EILU) conducted by the National Statistics Institute (INE) in 2019. The Survey investigated the dynamics of the entry into the labour market of graduates five years after completing their degree, by studying the 2019 employment status of those who had graduated in the 2013-2014 academic year.
The EILU is a good tool for studying monetary income, as it includes a large amount of information on other fundamental aspects such as graduates’ social background, place of residence, foreign language skills, technological skills, field of study, type of university attended, current occupation and type of working hours.
The original sample consisted of 30 270 individuals, of whom 4935 were excluded. Among the individuals excluded were 357 people with disabilities, as their employment trajectories differed significantly from those of other members of the population (Díaz, 2016; Font, 2018). The remainder were excluded due to missing information on one or more variables (268), or because they were unemployed or inactive at the time of the Survey (4310). As the dependent variable was employment income, this data item was missing for unemployed and inactive people.
Analysis techniques
Linear regression was the main technique used to analyse the characteristics of graduates, by looking at their monthly employment income. This quantitative approach helps to understand how the independent variables relate specifically to earnings five years after completing a degree. This tool is useful to identify the magnitude of the influence of each independent variable on earnings, and to ascertain whether these relationships are statistically significant.
Based on this linear regression, four predictive marginal analyses were conducted to gain a deeper understanding of the interaction between the independent variables and their effect on income prediction: 1) gender and field of study; 2) gender and type of working hours; 3) gender and the educational dominance of graduates; and 4) region of residence and educational dominance.
In addition to the linear regression used, several robustness tests have been included in the annexes that were employed to check the consistency of the results obtained, and to ensure that the findings were valid in different contexts and subgroups of the sample. These confirm that the conclusions did not depend on specific modelling or on a particular set of data. It was decided to introduce additional models for both full-time and part-time employees in order to consider different forms of labour market participation.
A second linear regression limited to full-time employees has been included in the annexes (Table 4). It is intended to address any concerns about accounting for the influence of differences between full-time and part-time workers on the overall results (Table 3). By restricting the analysis to those employed on a full-time basis, it was possible to isolate the effect of this population group, as its members generally exhibit more stable and comparable wage patterns. This allowed for a more accurate assessment of the relationship between the independent variables and monetary income, without the potential distortion caused by the variability associated with part-time employment.
A logistic regression was introduced that modelled the probabilities of a graduate being in a high (€1500 or more) or low (less than €1499) income group, including both full-time and part-time employees. This approach made it possible to explore the factors that influenced the probability of reaching a significant wage threshold, which added an additional layer of robustness to the analysis. Income was treated as a binary variable in order to capture the contrasts between the two groups of employees and how different characteristics influenced their likelihood of achieving a high or low income. The decision was taken by looking at the distribution of the population according to their income and observing that €1500 was about half of the distribution (46.8 % of the graduates had earnings of up to €1500).
Finally, an ordinal regression was used with the monthly income variable, categorised into different ranges (less than €1000, €1000-1499, €1500-1999, €2000-2499 and more than €2500). This model was useful because it allowed income to be analysed as a variable reflecting differential wage levels. This technique makes it possible to capture nuances in between different ranges, and how independent variables influence the probability of being in a higher or lower range of the wage distribution.
Results
Table 2 below shows the distribution of all the variables used in the analysis. In addition to the percentages for each category, the distribution by sex has been added.
Table 3 shows the results obtained from the linear regression analysis. Using 25 335 individuals, with a goodness of fit (R-squared) of 0.35.
The results yielded a clear and significant gender inequality among university graduates in Spain. Thus, it could be seen that female university students earned a monthly income of approximately 120 euros less than their male counterparts. Despite this, the gender pay gap was 7.44 %. Although this was a large gap, it was lower than the gap in the labour market as a whole, which, according to the latest studies, amounts to 13.1 % (Simó-Noguera et al., 2023)2.
Regarding the impact of social class of origin on income, results notably included a degree of support for the idea that a university education helps to correct social background inequalities. It is important to note that the coefficient corresponding to the high category, which represents graduates with university-educated parents, did not differ from that of students from lower socio-economic backgrounds. Even those of medium level had a difference of 31 euros less than those coming from lower social backgrounds. This finding underlines the influence of education on intergenerational mobility and suggests that university education continues to mitigate differences in socio-economic background (Fachelli, Torrents and Navarro-Cendejas, 2014b).
On the other hand, people over the age of thirty were found to earn on average 86 euros more per month than those who were younger. This was a predictable result, since these individuals may have accumulated work experience before or during their university studies. Moreover, as previous research has shown for the Spanish case, graduates aged thirty and above saw their working conditions improved (García-Montalvo, 2007). However, as mentioned in the methodology section, this is a dichotomous variable and does not allow for more accurate tests on the effect of age. It should therefore be treated with some caution.
The variable that assessed graduates’ income based on their field of study indicated that the highest-paid graduates were those from the Health Sciences field. These graduates had a monthly income that was almost 250 euros higher than the monthly income of those who had studied Arts and Humanities (reference category) five years after completing their degree. In second place were Engineering and Architecture graduates, who earned an average income that was 274 euros higher than the income of those who had studied Arts and Humanities. In third place were graduates in professionally accredited degree programmes in the Social Sciences field, such as Business Management and Administration, Business, and Law, who earned an average additional income of approximately 150 euros net per month compared to the reference category. Finally, there were no significant differences between graduates who were Natural Sciences and Social Sciences degree holders and the reference category (Humanities).
With regard to the type of university where graduates completed their studies, it was corroborated that graduates from private universities out-earned their counterparts from public universities by 115 euros per month. Using earlier data from 2014, Canal-Domínguez and Rodríguez-Gutiérrez (2020) showed that at least in the short term, earnings by graduates of private universities did not differ from those by graduates of public universities.
In terms of the influence of ICT, having a higher level of proficiency led to higher income. As authors such as Manning (2004) and Dwyer (2013) have noted, the labour market increasingly requires and values workers with good technological skills. For the Spanish case, it was established that people with an expert level in these skills obtained a net monthly salary increase of around 75 euros per month.
On the other hand, the variable measuring the effect of languages on earnings did not show a significant impact on the wage differential among graduates. However, this result may be due to contextual factors that modulate the effect. In less international labour markets, knowledge of additional languages may not be as highly valued, as many companies operate mainly in local or regional environments. Although no direct impact was observed in this analysis, future studies could explore how variables such as labour market internationalisation, sector type and job characteristics could affect the relationship between languages and earnings.
The factor that generated the most wage differences among university graduates was the type of working hours. People in full-time employment earned 754 euros more than people in part-time employment. It was difficult to determine whether individuals chose part-time jobs in order to have more time available to engage in other activities or whether they were unable to access full-time jobs, even though that would have been their preference. These additional factors need to be considered to fully understand the dynamics behind these wage disparities.
Significant differences were observed according to the geographical areas where the graduates were located. Firstly, those who chose to live and work abroad after obtaining their university degree had higher incomes, earning slightly more than five hundred euros more than residents of the reference region (Northwest, which includes Galicia, Asturias and Cantabria). Within Spain, graduates residing in the Autonomous Community of Madrid had the highest income, since they earned approximately 150 euros more than those residing in the Northwest region. In second and third place were graduates residing in the Northeast and Eastern regions (which included Euskadi, Navarre, La Rioja, Aragon, Catalonia, Valencia and the Balearic Islands), who earned about 100 euros more than those residing in the Northwest region.
The regions with the lowest incomes were, on the one hand, graduates who were resident in the Canary Islands, who earned around 30 euros more per month than the reference category; and on the other hand, residents in the Central region (Castilla y León, Castilla-La Mancha and Extremadura), who earned only five euros more than residents in the reference category. Finally, residents in the Southern region (Andalusia, Murcia, Ceuta and Melilla) had no significant income differences with the Northeastern region.
An additional set of analyses carried out to ensure the robustness of the results presented in the body of the paper is available in the annex.
Analysis of the interactions between variables
Various interactions between selected variables and their respective predictive margins are presented with the aim of gaining a deeper and more practical understanding of the regression model results. These show the non-linear relationships between the predictor variables and the response variable, as well as quantifying the effects between variables more accurately.
First, the marginal predictors for the sex and field of studies variables shown in Graph 1 establish that the best paid fields were the Health Sciences, followed by the Social Sciences (Economics, Business Management, Business Administration and Law) and by Engineering and Architecture. The lowest earning fields were the Natural Sciences, Social Sciences, and Arts and Humanities. Although these fields followed the same order for men and women, the predicted marginals indicated a clear gender inequality that always places women in a worse position than their male counterparts. Specifically, men earned higher incomes in fields such as Arts and Humanities (the lowest earning field) than women who held Social Sciences, Natural Sciences, or Arts and Humanities degrees. Men with degrees in Engineering and Architecture also had higher incomes than women in Health Science fields (generally better paid). These results would call into question the discourse that claims that women have to study STEM (Science, Technology, Mathematics and Engineering) fields in order to achieve equality, since regardless of the field of study pursued by women, they will always earn lower incomes than their male counterparts3.
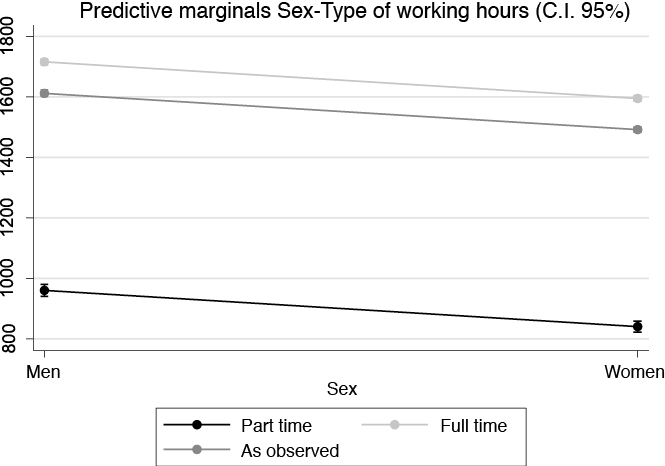
Graph 2 presents the analysis of the interaction between sex and type of working hours, which yields results that reinforce the understanding of wage disparities in terms of gender and working hours. Part-time workers have lower incomes than full-time workers. This finding was supported by research by Martínez-Moreno (2019), which highlighted how the type of working day disproportionately affects women. However, it is worth noting that the wage gap between male and female university graduates was consistent across all categories, with a discrepancy of 7 percentage points. This contrasts with the more pronounced gender disparities in the labour market in general.
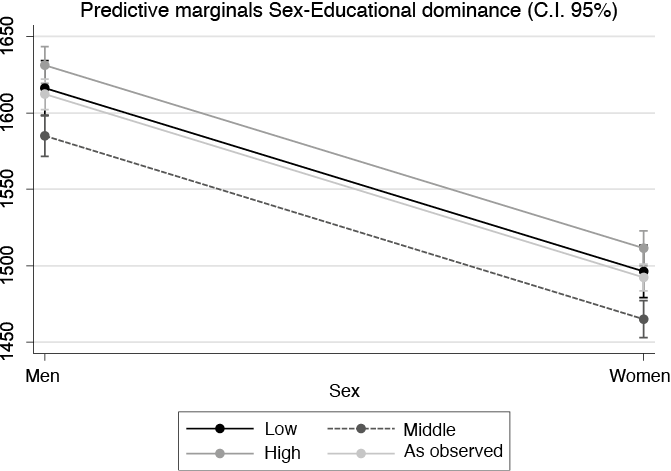
Graph 3 illustrates the interaction between educational dominance (which served as a proxy for social class background) and gender in relation to graduate earnings. A notable finding was that gender caused far more income differences than social class background. Regardless of social class background, women always lagged behind men in terms of wages. This suggests that gender disparities are a significant and persistent force influencing employment remuneration. Moreover, the minimal income gaps between social classes—which were observed to be statistically non-significant in the regression analysis—were corroborated. Specifically, graduates originating from family backgrounds in which both parents had attained only a low level of education were found to earn higher incomes than those whose parents had attained a medium level of education. This outcome lends further support to the thesis that university education functions as a mechanism of upward social mobility for individuals from socio-economically disadvantaged backgrounds (Fachelli et al., 2014).
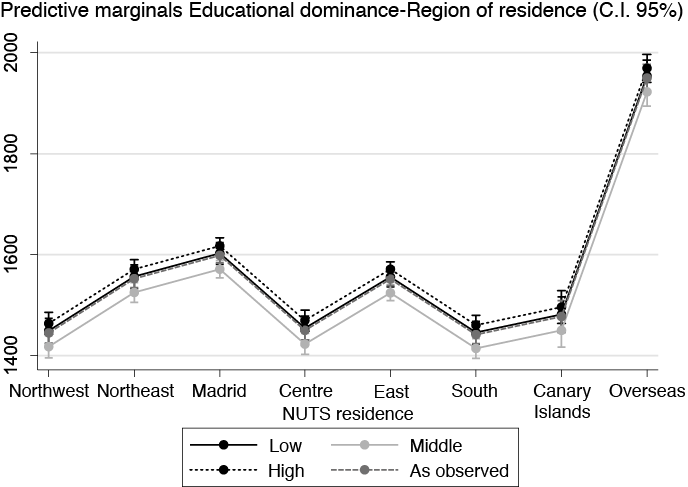
Graph 4 shows the interaction between respondents’ social class and region of residence in relation to their income. Although salary differences were minimal, it can be seen that educational dominance and region of residence were associated with salary differences. Salary inequality was more closely linked to place of work and residence than to social class background. This suggests that other variables such as geographical location and type of employment, had an even greater impact on salary inequalities.
Conclusions
One of the main conclusions of this study is that university education attenuates salary inequalities caused by differences in parents’ educational levels and, consequently, that higher education continues to be a driver of intergenerational social mobility. This supports the idea of university education as a social lift, but with differentiated stops, and underlines the importance of continuing to support a free, quality higher education system that enables the children of the working classes to access and complete their university studies. The fact that 52 % of graduates came from non-university households is an important societal achievement.
The study also sheds light on the influence of the chosen field of study on the earnings of graduates. The wage differentials between fields, with Health and Social Sciences (Economics, Law, Business Administration) and Engineering at the top, and the Natural Sciences, Social Sciences and Humanities at the bottom, stress the need to equip all graduates with advanced ICT training, which would have an impact on their earnings.
However, from a gender perspective, the persistent inequality in the labour market stands out, with women systematically having a lower income than men with similar characteristics. This inequality is a major concern that requires immediate attention in terms of public policies and affirmative action in the employment and educational spheres, such as promoting transparent wage practices and imposing sanctions for discrimination.
Furthermore, the analyses conducted between gender and field of study complement the existing literature on gender and field of study wage disparities (Jiménez-García, 2020). Although previous research has pointed out that the type of degree can explain larger wage differentials, either due to the demand for specific skills in the labour market (Dewyer, 2013; Manning, 2004) or to discrimination (Cortina, Rodríguez and González, 2021), it is important to note that women continue to earn less than men, regardless of the field of study. This finding demonstrates that the economic profitability of a university field of study differs according to gender, thereby underscoring the need to address potential inequalities within each academic discipline, particularly those arising from the choice of certain degree programmes and specialisms over others.
In terms of territorial differences, the study shows a highly unequal salary distribution depending on the region of residence. While graduates who earn the most are those living abroad, in Spain, Madrid is by far the area with the highest income. This territorial inequality may be related to the concentration of the most qualified jobs and opportunities in certain geographical areas with greater industrial and technological development, and emphasises the significance of extending regional development and decentralisation policies.
It is also noted that graduates from private universities earn more on average than graduates from public universities. This salary disparity is not a reflection of differences in the quality of education provided in these institutions. Private universities may often have greater financial resources and better access to social networks that connect directly with employers, providing their students with greater social capital and a wider range of career development opportunities. This can translate into higher employability and ultimately higher incomes.
It is important to mention two limitations in relation to the effect of social background. On the one hand, unfortunately, the Survey did not include the essential variable of the parents’ occupation. This is an important consideration, since we have used parental education level as a proxy, as it is a class indicator commonly used in sociology that has a high correlation with social class. The second limitation is that the analysis has focused only on university graduates and therefore does not include those from working class backgrounds who did not access or complete university education. Consequently, while the results suggest that university education is a factor of social mobility for those who gain access to it, this statement cannot be generalised to the entire working class. In fact, many working-class people do not go to university, which limits their potential for upward social mobility.
An opportunity for future research lies in the possibility of deepening the analysis of the types of occupations and branches of activity, as well as of horizontal inequalities between men and women within the same occupation. It will also be essential to broaden the observation window and conduct longitudinal studies that can offer a deeper and more dynamic understanding of salary trends and the relationships between variables over time. This opportunity underscores the importance of gathering long-term data for future research that seeks to more thoroughly explore the complexities and inequalities of the labour market. Ultimately, this would provide an assessment as to whether the impact of university education persists over time in terms of reducing salary disparities linked to social class or gender.
Bibliography
Ballarino, Gabriele and Bratti, Massimiliano (2009). “Field of Study and University Graduates’ Early Employment Outcomes in Italy During 1995-2004”. Labour, 23(3): 421-457. doi: 10.1111/j.1467-9914.2009.00459.x
Ballarino, Gabriele; Bernardi, Fabrizio and Panichella, Nazareno (2013). “Social Inequality, Educational Expansion and Return to Credentials: A Comparison Between Italy and Spain”. XI Congreso Español de Sociología. Madrid: Universidad Complutense de Madrid y Federación Española de Sociología.
Barone, Carlo (2011). “Some Things Never Change: Gender Segregation in Higher Education Across Eight Nations and Three Decades”. Sociology of Education, 84(2): 157-176. doi: 10.1177/0038040711402099
Benson, Alan (2015). “A Theory of Dual Job Search and Sex-Based Occupational Clustering”. Industrial Relations, 54(3): 367-400. doi: 10.1111/irel.12095
Blau, Peter M. and Duncan, Otis D. (1967). The American Occupational Structure. New York: Wiley and Sons.
Breen, Richard and Goldthorpe, John H. (1997). “Explaining Educational Differentials: Towards a Formal Rational Action Theory”. Rationality & Society, 9: 273-305. doi: 10.1177/104346397009003002
Breen, Richard and Luijkx, Ruud (2004). Social Mobility in Europe Between 1970 and 2000. In: R. Breen (ed.). Social Mobility in Europe (pp. 37-75). Oxford: Oxford University Press. doi: 10.1093/0199258457.003.0003
Canal-Domínguez, Juan Francisco and Rodríguez-Gutiérrez, César (2020). “Universidad pública frente a universidad privada”. Revista Española de Investigaciones Sociológicas, 169: 21-39. doi: 10.5477/cis/reis.169.21
Carabaña, Julio (2005). Educación y movilidad social. In: V. Navarro (coord.). El Estado de Bienestar en España (pp. 246-289). Madrid: Tecnos.
Carabaña, Julio (2011). Cada vez más clase media. Sobre la evolución del origen social de los universitarios. Madrid: Universidad Complutense de Madrid. Paper presented as part of the ITUNEQMO project.
Carnoy, Martin (2006). Economía de la educación. Barcelona: Editorial UOC.
Charles, Maria and Bradley, Karen (2009). “Indulging our Gendered Selves? Sex Segregation by Field of Study in 44 countries”. American Journal of Sociology, 114(4): 924-976. doi: 10.1086/595942
Cortina, Clara; Rodríguez, Jorge and González, María José (2021). “Mind the Job: The Role of Occupational Characteristics in Explaining Gender Discrimination”. Social Indicators Research, 156(1): 91-110. doi: 10.1007/s11205-021-02646-2
Díaz Velázquez, Eduardo (2016). El acceso a la condición de ciudadanía de las personas con discapacidad intelectual: el caso de España. Vázquez Ferreira, Miguel Ángel (dir.). Madrid: Universidad Complutense de Madrid. (Doctoral thesis). Available at: https://docta.ucm.es/entities/publication/17065b6a-c2d7-4db9-b3df-d55ceb255cb8, access December 2, 2024.
Dwyer, Rachel (2013). “The Care Economy? Gender, Economic Restructuring, and Job Polarization in the U.S. Labor Market”. American Sociological Review, 78(3): 390-416. doi: 10.1177/0003122413487197
Duncan, Otis D. (1966). “Path Analysis: Sociological Examples”. American Journal of Sociology, 72(1): 1-16. doi:10.1086/224256
Duncan, Otis D.; Featherman, David and Duncan, Beverly (1972). Socioeconomic Background and Achievement. New York: Academic Press.
Eurostat (2024). Nomenclature of Territorial Units for Statistics. Available at: https://ec.europa.eu/eurostat/web/nuts, access November 10, 2024.
Fachelli, Sandra (2011). Exploraciones sobre indicadores de equidad. Barcelona: Universitat Autònoma de Barcelona. Paper presented at the internal ITUNEQMO Seminar. GRET.
Fachelli, Sandra and Planas, Jordi (2011). “Equidad y movilidad intergeneracional de los titulados universitarios catalanes”. Revista Papers, 96(4): 1281-1305. doi: 10.5565/rev/papers/v96n4.353
Fachelli, Sandra and Planas, Jordi (2014a). “Inserción profesional de los universitarios: de la expansión a la crisis”. Revista Española De Sociología, 21. Available at: https://recyt.fecyt.es/index.php/res/article/view/65360, access May 6, 2024.
Fachelli, Sandra; Torrents, Daniel and Navarro-Cendejas, José (2014b). “La universidad española suaviza las diferencias de clase en la inserción laboral?”. Revista de Educación, 364: 119-144. doi: 10.4438/1988-592X-RE-2014-364-257
Font García, Javier (2018). Ajustes razonables en el ámbito laboral. In: J. L. Rey and L. Mateo (eds.). El empleo de las personas con discapacidad: oportunidades y desafíos (pp. 191-202). Madrid: Dykinson. Available at: https://digital.casalini.it/9788491488378, access December 13, 2024.
Gambetta, Diego (1987). Were They Pushed or Did They Jump? London: Cambridge University Press. doi: 10.1017/CBO9780511735868
García-Montalvo, José (2007). “La inserción laboral de los universitarios: entre el éxito y el desánimo”. Social Panorama, 6: 92-106. Available at: https://www.funcas.es/wp-content/uploads/Migracion/Articulos/FUNCAS_PS/006art10.pdf, access May 20, 2024.
Goldthorpe, John (2007). On Sociology: Numbers, Narrative and the Integration of Research and Theory. California: Stanford University Press.
Hansen, Marianne (2001). “Education and Economic Rewards. Variations by Social-class Origin and Income Measures”. European Sociological Review, 17(3): 209-231. doi: 10.1093/esr/17.3.209
Hout, Michael (1984). “Status, Autonomy, and Training in Occupational Mobility”. American Journal of Sociology, 89: 1379-1409. doi: 10.1086/228020
Hout, Michael (1988). “More Universalism, Less Structural Mobility: The American Occupational Structure in the 1980s”. American Journal of Sociology, 93(6): 1358-1400. doi: 10.1086/228904
Hout, Michael (2020). Los efectos igualadores de la educación como “selección negativa”: las dos caras de un mismo efecto de interacción. In: O. Salido and S. Fachelli (eds.). Perspectivas y fronteras en el estudio de la desigualdad social: movilidad social y clases sociales en tiempos de cambio. Madrid: Centro de Investigaciones Sociológicas.
Instituto Nacional de Estadística (2019). Microdatos de la encuesta de inserción laboral de titulados universitarios.
Jiménez-García, Juan Ramón (2018). “Gender Is the Key: An Analysis of the Gender Inequalities in the Access to Employment during the Great Recession in Spain”. XIX International Sociological Association World Congress of Sociology, 550(1): 1-30.
Jiménez-García, Juan Ramón (2020). “¿Y después de la universidad qué? Análisis de las transiciones del sistema educativo al empleo en España”. Revista Internacional de Sociología, 78(3): 1-13. doi: 10.3989/ris.2020.78.3.18.133
Manning, Alan (2004). “We Can Work It Out: The Impact of Technological Change on the Demand for Low Skill Workers”. Scottish Journal of Political Economy, 51(5): 581-609. doi: 10.1111/j.0036-9292.2004.00322.x
Martínez García, José Saturnino (2007). “Clase social, género y desigualdad de oportunidades educativas”. Revista de Educación, 342: 287-306. Available at: https://hdl.handle.net/20.500.12799/1281, access October 11, 2024.
Martínez García, José Saturnino (2017). “Sobrecualificación de los titulados universitarios y movilidad social”. Papers. Revista de Sociología, 102(1): 29-52. doi: 10.5565/rev/papers.2225
Martínez García, José Saturnino and Merino, Rafael (2011). “Formación profesional y desigualdad de oportunidades educativas por clase social y género”. Revista Tempora, 13: 337. Available at: http://riull.ull.es/xmlui/handle/915/2421, access October 16, 2024.
Martínez Pastor, José Ignacio (2020). “Origen social y paro: ¿importa la ocupación de los padres para evitar el desempleo?”. Revista Internacional de Sociología, 78(3): e161. doi: 10.3989/ris.2020.78.3.19.005
Merino, Rafael and García, Maribel (2007). Itineraris de formació i inserció laboral dels joves a Catalunya. Barcelona: Jaume Bofill Foundation. Available at: https://fundaciobofill.cat/uploads/docs/t/1/i/e/7/o/z/u/d/448.pdf, access July 15, 2024.
Moreno, Carolina M. (2020). Part-time Work and Indirect Sex Discrimination in Access to Social Protection: An Unresolved Issue. La Coruña: University of Santiago de Compostela. Servicio de Publicaciones.
Ochsenfeld, Fabian (2014). “Why Do Women’s Fields of Study Pay Less? A test of Devaluation, Human Capital, and Gender Role Theory”. European Sociological Review, 30(4): 536-548. doi: 10.1093/esr/jcu060
Opheim, Vibeke (2007). “Equal Opportunities? The Effect of Social Background on Transition from Education to Work Among Graduates in Norway”. Journal of Education and Work, 20(3): 255-282. doi: 10.1080/13639080701464533
Ortiz, Luis and Rodríguez-Menés, Jorge (2016). “The Positional Value of Education and its Effect on General and Technical Fields of Education: Educational Expansion and Occupational Returns to Education in Spain”. European Sociological Review, 32(2): 216-237. doi: 10.1093/esr/jcv085
Ortiz, Luis and Wolbers, Maarten H. J. (2011). “The Role of Educational Expansion in the Early Occupational Attainment Process: Empirical Evidence from a Cross-national Perspective”. UPF Working Paper, 9. Available at: https://bit.ly/3hwHex0, access August 10, 2024.
Reisel, Liza (2013). “Is More Always Better? Early Career Returns to Education in the United States and Norway”. Research in Social Stratification and Mobility, 31(1): 49-68. doi: 10.1016/j.rssm.2012.10.002
Schmelzer, Paul and Veira Ramos, Antonio (2016). “Varieties of Wage Mobility in Early Career in Europe”. European Sociological Review, 32(2): 175-188. doi: 10.1093/esr/jcv079
Schröder, Heike and Ganzeboom, Harry B. G. (2014). “Measuring and Modelling Level of Education in European Societies”. European Sociological Review, 30(1): 119-136. doi: 10.1093/esr/jct026
Shavit, Yossi; Yaish, Meir and Bar-Haim, Eyal (2007). The Persistence of Persistent Inequality. In: S. Scherer; R. Pollak; G. Otte and M. Gangl (eds.). From Origin to Destination: Trends and Mechanisms in Social Stratification Research. Frankfurt: Campus Verlag.
Simó-Noguera, Carles; Mondragón-García, Elvira; Carbonell-Asins, Juan and Romero-Crespo, Juan (2023). “La observación de la brecha salarial de género ajustada. En busca de la discriminación directa en España”. Revista Internacional de Sociología, 81(3). doi: 10.3989/ris.2023.81.3.22.00490
Srivastava, Sameer B. and Sherman, Eliot L. (2015). “Agents of Change or Cogs in the Machine? Reexamining the Influence of Female Managers on the Gender Wage Gap”. American Journal of Sociology, 120(6): 1778-1808. doi: 10.1086/681960
Subirats, Marina (2011). Relació entre titulacions superiors i classe social d’origen. Barcelona: Universitat Autònoma de Barcelona. Paper presented at the internal seminar of the ITUNEQMO project.
Torrents, Daniel (2012). “Access to University in Spain in 2009: The Determining Factors for Access”. VI Conference on Youth and Society in Europe and the Mediterranean, Barcelona.
Vallet, Louis-André (2005). “Quarante années de mobilité sociale en France. L’évolution de la fluidité sociale à la lumière de modèles récents”. Revue Française de Sociologie, 40: 5-64. doi: 10.2307/3322517
Warren, John Robert, Hauser, Robert M. and Sheridan, Jennifer (2002). “Occupational Stratification Across the Life Course: Evidence from the Wisconsin Longitudinal Study”. American Sociological Review, 67: 432-455. doi: 10.1177/000312240206700306
Wolbers, Maarten H. J. (2000). “Effects of Level Education Mobility in Employment and Netherlands Unemployment”. European Sociological Review, 16(2): 185-200. doi: 10.1093/esr/16.2.185
Wolbers, Maarten H. J. (2007). “Patterns of Labour Market Entry: A Comparative Perspective on School-to-Work Transitions in 11 European Countries”. Acta Sociologica, 50(3): 189-210. doi: 10.1177/0001699307080924
Table 4. Linear regression of income of full-time employed graduates
|
|
Coef. |
Std. Err. |
t |
P>t |
[95 % conf. interval] |
||
|
Sex |
Women (ref. cat. men) |
-129.879 |
7.811 |
-16.63 |
0 |
-145.189 |
-114.569 |
|
Educational dominance |
Medium (ref. cat. low) |
-38.776 |
11.089 |
-3.5 |
0 |
-60.511 |
-17.040 |
|
|
High |
21.755 |
10.908 |
1.99 |
0.046 |
0.375 |
43.136 |
|
Age |
over 30 (ref. cat. under 30) |
92.294 |
7.751 |
11.91 |
0 |
77.101 |
107.487 |
|
Field of study |
Social Sciences Econ. (ref. cat. Arts and Humanities) |
143.175 |
18.475 |
7.75 |
0 |
106.963 |
179.387 |
|
|
Social Sciences |
4.995 |
17.355 |
0.29 |
0.773 |
-29.022 |
39.012 |
|
|
Engineering and Architecture |
197.091 |
17.941 |
10.99 |
0 |
161.925 |
232.258 |
|
|
Health Sciences |
324.213 |
19.006 |
17.06 |
0 |
286.960 |
361.466 |
|
|
Natural sciences |
-4.456 |
20.244 |
-0.22 |
0.826 |
-44.136 |
35.224 |
|
Type of University |
Private (ref. cat. public) |
135.893 |
10.271 |
13.23 |
0 |
115.760 |
156.025 |
|
ICT level |
Advanced (ref. cat. basic) |
2.438 |
12.629 |
0.19 |
0.847 |
-22.316 |
27.192 |
|
|
Expert |
77.215 |
14.876 |
5.19 |
0 |
48.057 |
106.374 |
|
Languages |
One language (ref. cat. only native language) |
-9.452 |
18.619 |
-0.51 |
0.612 |
-45.947 |
27.042 |
|
|
Two or more |
28.892 |
19.032 |
1.52 |
0.129 |
-8.412 |
66.196 |
|
NUTS regions |
Northeast (ref. cat. Northwest) |
111.285 |
15.583 |
7.14 |
0 |
80.741 |
141.828 |
|
|
Madrid |
167.435 |
14.398 |
11.63 |
0 |
139.213 |
195.657 |
|
|
Centre |
-2.949 |
16.182 |
-0.18 |
0.855 |
-34.667 |
28.770 |
|
|
East |
107.775 |
13.991 |
7.7 |
0 |
80.352 |
135.198 |
|
|
South |
-2.119 |
15.697 |
-0.14 |
0.893 |
-32.887 |
28.649 |
|
|
Canary Islands |
37.713 |
21.457 |
1.76 |
0.079 |
-4.344 |
79.770 |
|
|
Overseas |
547.372 |
19.081 |
28.69 |
0 |
509.971 |
584.772 |
|
Constant |
|
1415.164 |
29.862 |
47.39 |
0 |
1356.633 |
1473.696 |
Number of observations: 21,873.
R squared: 0.14.
Source: Prepared by the authors based on data from EILU (2019).
Table 5. Binary Logistic Regression of having high income vs. low income (for all employees - both full-time and part-time)
|
|
|
Odds Ratio |
Standard error |
Z |
P>z |
Confidence Interval (95 %) |
|
|
Sex |
Women (ref. cat. men ) |
0.738 |
0.022 |
-10.12 |
0 |
0.695 |
0.782 |
|
Educational dominance |
Medium (ref. cat. low) |
0.873 |
0.037 |
-3.18 |
0.001 |
0.804 |
0.949 |
|
|
High |
1.088 |
0.046 |
2.01 |
0.044 |
1.002 |
1.182 |
|
Age |
over 30 (ref. cat. under 30) |
1.439 |
0.043 |
12.16 |
0 |
1.357 |
1.526 |
|
Field of study |
Social Sciences Econ. (ref. cat. Arts and Humanities) |
1.146 |
0.079 |
1.99 |
0.047 |
1.002 |
1.312 |
|
|
Social Sciences |
0.919 |
0.059 |
-1.32 |
0.188 |
0.811 |
1.042 |
|
|
Engineering and Architecture |
1.631 |
0.110 |
7.28 |
0 |
1.430 |
1.861 |
|
|
Health Sciences |
2.333 |
0.167 |
11.82 |
0 |
2.027 |
2.685 |
|
|
Natural sciences |
0.723 |
0.055 |
-4.29 |
0 |
0.624 |
0.838 |
|
Type of University |
Private (ref. cat. public) |
1.770 |
0.074 |
13.74 |
0 |
1.631 |
1.920 |
|
ICT level |
Advanced (ref. cat. basic) |
0.916 |
0.044 |
-1.84 |
0.065 |
0.834 |
1.006 |
|
|
Expert |
1.231 |
0.070 |
3.64 |
0 |
1.101 |
1.377 |
|
Languages |
One language (ref. cat. only native language) |
1.103 |
0.078 |
1.38 |
0.166 |
0.960 |
1.266 |
|
|
Two or more |
1.145 |
0.083 |
1.87 |
0.061 |
0.994 |
1.318 |
|
Type of working hours |
Full time (ref. cat. part time) |
15.790 |
1.062 |
41.01 |
0 |
13.839 |
18.015 |
|
NUTS regions |
Northeast (ref. cat. Northwest ) |
1.491 |
0.088 |
6.74 |
0 |
1.328 |
1.675 |
|
|
Madrid |
1.645 |
0.091 |
9.04 |
0 |
1.477 |
1.832 |
|
|
Centre |
1.015 |
0.062 |
0.24 |
0.81 |
0.900 |
1.144 |
|
|
East |
1.452 |
0.077 |
7.02 |
0 |
1.308 |
1.611 |
|
|
South |
0.997 |
0.059 |
-0.04 |
0.966 |
0.888 |
1.120 |
|
|
Canary Islands |
1.112 |
0.090 |
1.3 |
0.192 |
0.948 |
1.304 |
|
|
Overseas |
4.796 |
0.403 |
18.66 |
0 |
4.068 |
5.655 |
|
Constant |
|
0.045 |
0.006 |
-24.08 |
0 |
0.035 |
0.058 |
Number of observations: 25,335.
Pseudo R Squared: 0.09.
Source: Prepared by the authors based on data from EILU (2019).
Table 6. Ordinal logistic regression
|
Variables |
Categories |
Coef. |
Std. Err. |
z |
P>z |
[95 % Conf. Interval] |
|
|
Sex |
Women (ref. cat. men) |
-0.398 |
0.025 |
-15.74 |
0.000 |
-0.448 |
-0.348 |
|
Educational dominance |
Medium (ref. cat. low) |
-0.128 |
0.036 |
-3.85 |
0.000 |
-0.198 |
-0.058 |
|
|
High |
0.091 |
0.035 |
2.59 |
0.010 |
0.022 |
0.159 |
|
Age |
over 30 (ref. cat. under 30 ) |
0.313 |
0.025 |
12.53 |
0.000 |
0.264 |
0.361 |
|
Field of study |
Social Sciences Econ. (ref. cat. Arts and Humanities) |
0.356 |
0.059 |
6.02 |
0.000 |
0.24 |
0.472 |
|
|
Social Sciences |
-0.044 |
0.054 |
-0.81 |
0.420 |
-0.15 |
0.063 |
|
|
Engineering and Architecture |
0.574 |
0.057 |
10.08 |
0.000 |
0.462 |
0.685 |
|
|
Health Sciences |
1.023 |
0.06 |
16.97 |
0.000 |
0.905 |
1.141 |
|
|
Natural sciences |
-0.14 |
0.064 |
-2.18 |
0.029 |
-0.266 |
-0.014 |
|
Type of University |
Private (ref. cat. public) |
0.486 |
0.033 |
14.74 |
0.000 |
0.421 |
0.551 |
|
ICT level |
Advanced (ref. cat. basic) |
0.014 |
0.04 |
0.36 |
0.717 |
-0.064 |
0.093 |
|
|
Expert |
0.269 |
0.048 |
5.64 |
0.000 |
0.176 |
0.362 |
|
Languages |
One language (ref. cat. only native language) |
0.023 |
0.061 |
0.38 |
0.704 |
-0.096 |
0.143 |
|
|
Two or more |
0.126 |
0.062 |
2.01 |
0.044 |
0.003 |
0.248 |
|
Type of working day |
Full time (ref. cat. part time) |
3.078 |
0.044 |
69.4 |
0.000 |
2.991 |
3.165 |
|
NUTS regions |
Northeast (ref. cat. Northwest) |
0.399 |
0.049 |
7.79 |
0.000 |
0.292 |
0.488 |
|
|
Madrid |
0.534 |
0.047 |
11.41 |
0.000 |
0.442 |
0.626 |
|
|
Centre |
0.006 |
0.052 |
0.11 |
0.913 |
-0.097 |
0.108 |
|
|
East |
0.361 |
0.045 |
8 |
0.000 |
0.272 |
0.449 |
|
|
South |
-0.035 |
0.051 |
-0.68 |
0.496 |
-0.134 |
0.065 |
|
|
Canary Islands |
0.115 |
0.07 |
1.64 |
0.102 |
-0.023 |
-0.023 |
|
|
Overseas |
1.911 |
0.064 |
29.67 |
0.000 |
1.783 |
2.035 |
|
|
Ref. (less than €1000) |
|
|||||
|
Cut-off 1 |
€1000-1499 |
1.283 |
0.102 |
1.084 |
1.482 |
||
|
Cut-off 2 |
€1500-1999 |
3.466 |
0.104 |
3.262 |
3.671 |
||
|
Cut-off 3 |
€2000-2499 |
5.089 |
0.106 |
3.262 |
3.671 |
||
|
Cut-off 4 |
More than €2500 |
6.283 |
0.107 |
|
|
6.073 |
6.493 |
Number of observations: 25,335.
Pseudo R Squared: 0.137.
Source: Prepared by the authors based on data from EILU (2019).
1 This paper has been produced thanks to the Spanish university system’s 2021–2023 requalification programme, under the Margarita Salas scheme for the training of young PhD graduates, promoted by the Ministry of Universities of the Government of Spain and funded by the European Union through NextGenerationEU as part of the Recovery, Transformation and Resilience Plan. It has also been carried out as part of the INCASI2 project, which has received funding from the European Union’s Horizon Europe research and innovation programme under Marie Sklodowska-Curie grant agreement no. 101130456 (https://incasi.uab.es). However, the views and opinions expressed are solely those of the authors and do not necessarily reflect those of the European Union or the European Research Executive Agency. Neither the European Union nor the funding authority can be held responsible for them.
2 See occupation and branch of activity by sex in annexes.
3 An analysis controlling for occupation and branch of activity, or differences in the same degrees, could narrow these differences.
Table 1. Employment status of graduates and of the overall Spanish population
|
University graduates |
Spanish population ( %) ** |
|||||
|
Sex |
In employment |
Unemployed |
Inactive |
In employment |
Unemployed |
Inactive |
|
Men |
87.8 |
6.6 |
5.6 |
64.3 |
12.5 |
23.2 |
|
Women |
84.9 |
8.3 |
6.8 |
52.8 |
16.0 |
31.2 |
|
Total |
86.1 |
7.6 |
6.3 |
50.6 |
14.1 |
35.3 |
Source: *EILU, 2019 and **Labour Force Survey, average of the four quarters of 2019 (INE, 2019).
Table 2. Descriptive statistics of the variables used in the analyses
|
Variable |
Categories |
No. of men in each category |
No. of women in each category |
Total |
Column percentage |
% women in each category |
|
Net monthly income |
||||||
|
|
Less than €1000 |
1279 |
2812 |
4091 |
16.1 |
68.7 |
|
|
From €1000 to €1499 |
3158 |
4896 |
8054 |
31.8 |
60.8 |
|
|
From €1500 to €1999 |
3325 |
4273 |
7598 |
30.0 |
56.2 |
|
|
From €2000 to €2499 |
1833 |
1480 |
3313 |
13.1 |
44.7 |
|
|
More than €2500 |
1444 |
835 |
2279 |
9.0 |
36.6 |
|
Educational dominance (parental highest |
||||||
|
|
Low |
1804 |
2356 |
4160 |
16.4 |
56.6 |
|
|
Intermediate |
3671 |
5421 |
9092 |
35.9 |
59.6 |
|
|
High |
5564 |
6519 |
12 083 |
47.7 |
54.0 |
|
Age |
||||||
|
|
Under 30 years old |
4767 |
7820 |
12 587 |
49.7 |
62.1 |
|
|
Aged 30 years old or above |
6272 |
6476 |
12 748 |
50.3 |
50.8 |
|
Field of study |
||||||
|
|
Arts and Humanities |
514 |
1052 |
1566 |
6.2 |
67.2 |
|
|
Social sciences (Econ. Law, Business Management and Administration) |
1796 |
1979 |
3775 |
14.9 |
52.4 |
|
|
Social Sciences |
2700 |
5667 |
8367 |
33.0 |
67.7 |
|
|
Engineering and |
4150 |
2144 |
6294 |
24.8 |
34.1 |
|
|
Health Sciences |
921 |
2282 |
3203 |
12.6 |
71.2 |
|
|
Natural Sciences |
985 |
1172 |
2157 |
8.5 |
54.3 |
|
Type of University |
||||||
|
|
Public |
9312 |
12141 |
21453 |
84.7 |
56.6 |
|
|
Private |
1727 |
2155 |
3882 |
15.3 |
55.5 |
|
ICT level (1) |
||||||
|
|
Basic |
778 |
1926 |
2704 |
10.7 |
71.2 |
|
|
Advanced |
6470 |
10 552 |
17 022 |
67.2 |
62.0 |
|
|
Expert |
3791 |
1818 |
5609 |
22.1 |
32.4 |
|
Languages |
||||||
|
|
Only native language |
454 |
623 |
1077 |
4.3 |
57.8 |
|
|
One foreign language |
5923 |
7228 |
13 151 |
51.9 |
55.0 |
|
|
Two or more foreign |
4662 |
6445 |
11 107 |
43.8 |
58.0 |
|
Type of working day |
||||||
|
|
Part-time |
1035 |
2427 |
3462 |
13.7 |
70.1 |
|
|
Full time |
10 004 |
11 869 |
21 873 |
86.3 |
54.3 |
|
NUTS regions |
||||||
|
|
Northwest |
921 |
1554 |
2475 |
9.8 |
62.8 |
|
|
Northeast |
1391 |
1944 |
3335 |
13.2 |
58.3 |
|
|
Madrid |
2218 |
2583 |
4801 |
19.0 |
53.8 |
|
|
Centre |
1215 |
1642 |
2857 |
11.3 |
57.5 |
|
|
East |
2679 |
3396 |
6075 |
24.0 |
55.9 |
|
|
South |
1492 |
1811 |
3303 |
13.0 |
54.8 |
|
|
Canary Islands |
424 |
602 |
1026 |
4.0 |
58.7 |
|
|
Overseas |
699 |
764 |
1463 |
5.8 |
52.2 |
|
|
|
|||||
|
TOTAL |
|
11 039 |
14 296 |
25 335 |
100 |
56.4 |
(1) Basic level user (surfing the Internet, sending e-mails, copying or moving files or folders, writing text using a word processor, using simple formulas in spreadsheets). Intermediate user (formatting text, using more advanced formulas and creating graphs in spreadsheets, installing devices or software, using databases). Advanced user (writing macros, programming, troubleshooting software and hardware when the computer is not working properly).
Source: Prepared by the authors based on data from EILU, 2019.
Table 2. Descriptive statistics of the variables used in the analyses (Continuation)
Table 3. Linear regression of monthly income
|
|
|
Coef. |
Std. Err. |
t |
P>t |
[95 % Conf. Interval] |
|
|
Sex |
Women (ref. cat. men) |
-119.96 |
7.01 |
-17.12 |
0 |
-133.70 |
-106.23 |
|
Educational dominance |
Medium (ref. cat. low) |
-31.25 |
9.87 |
-3.17 |
0.002 |
-50.60 |
-11.90 |
|
|
High |
15.04 |
9.75 |
1.54 |
0.123 |
-4.07 |
34.15 |
|
Age |
over 30 (ref. cat. under 30) |
86.87 |
6.89 |
12.6 |
0 |
73.36 |
100.38 |
|
Field of study |
Social Sciences Econ. (ref. cat. Arts and Humanities) |
151.70 |
15.89 |
9.55 |
0 |
120.56 |
182.84 |
|
|
Social Sciences |
-7.08 |
14.43 |
-0.49 |
0.623 |
-35.37 |
21.20 |
|
|
Engineering and Architecture |
182.32 |
15.31 |
11.91 |
0 |
152.30 |
212.33 |
|
|
Health Sciences |
248.65 |
16.24 |
15.31 |
0 |
216.81 |
280.49 |
|
|
Natural sciences |
-16.04 |
17.39 |
-0.92 |
0.356 |
-50.13 |
18.04 |
|
Type of University |
Private (ref. cat. public) |
114.54 |
9.29 |
12.33 |
0 |
96.34 |
132.74 |
|
ICT level |
Advanced (ref. cat. basic) |
14.48 |
10.92 |
1.33 |
0.185 |
-6.91 |
35.88 |
|
|
Expert |
74.93 |
13.13 |
5.71 |
0 |
49.20 |
100.67 |
|
Languages |
One language (ref. cat. only native language) |
-7.01 |
16.60 |
-0.42 |
0.673 |
-39.54 |
25.53 |
|
|
Two or more |
23.12 |
16.96 |
1.36 |
0.173 |
-10.12 |
56.36 |
|
Type of working hours |
Full time (ref. cat. part time) |
754.03 |
9.77 |
77.21 |
0 |
734.89 |
773.17 |
|
NUTS regions |
Northeast (ref. cat. Northwest) |
107.57 |
13.83 |
7.78 |
0 |
80.46 |
134.68 |
|
|
Madrid |
153.52 |
12.95 |
11.86 |
0 |
128.15 |
178.90 |
|
|
Centre |
5.48 |
14.27 |
0.38 |
0.701 |
-22.49 |
33.46 |
|
|
East |
106.99 |
12.45 |
8.59 |
0 |
82.59 |
131.39 |
|
|
South |
-3.41 |
13.80 |
-0.25 |
0.805 |
-30.47 |
23.64 |
|
|
Canary Islands |
32.41 |
19.25 |
1.68 |
0.092 |
-5.31 |
70.13 |
|
|
Overseas |
505.10 |
17.34 |
29.13 |
0 |
471.12 |
539.09 |
|
Constant |
|
531.20 |
27.29 |
19.46 |
0 |
477.70 |
584.70 |
Number of observations: 25,335; R squared: 0.35.
Source: Prepared by the authors based on data from EILU (2019).
Graph 1. Linear prediction of income for men and women by field of study
Source: Prepared by the authors based on data from EILU, 2019.
Graph 2. Linear prediction of income for men and women by type of working hours.
Source: Prepared by the authors based on data from EILU, 2019.
Graph 3. Linear prediction of income for men and women by social class background
Source: Prepared by the authors based on data from EILU, 2019.
Graph 4. Linear prediction of income by social class background and region of residence
Source: Prepared by the authors based on data from EILU, 2019.
RECEPTION: July 5, 2024
REVIEW: September 24, 2024
ACCEPTANCE: March 11, 2025
Table 7. Description of occupations according to NCO categories for men and women
|
NCO description |
Men |
Women |
Total |
% Total |
% Men |
|
1. Business and Public Administration Management |
680 |
499 |
1179 |
4.5 |
57.7 |
|
2. Scientific and intellectual technicians and professionals |
6455 |
9150 |
15605 |
60.1 |
41.4 |
|
3. Support technicians and professionals |
1986 |
1785 |
3771 |
14.5 |
52.7 |
|
4. Administrative-type employees |
944 |
1705 |
2649 |
10.2 |
35.6 |
|
5. Workers in catering, personal, and protection services and trade salespersons |
674 |
1146 |
1820 |
7 |
37 |
|
6. Workers skilled in agriculture and fishing |
51 |
26 |
77 |
0.3 |
66.2 |
|
7. Craftspersons and skilled workers in the manufacturing, construction and mining industries, except installation and machinery operators |
153 |
56 |
209 |
0.8 |
73.2 |
|
8. Installation and machinery operators and assemblers |
125 |
34 |
159 |
0.6 |
78.6 |
|
9. Unskilled workers |
210 |
192 |
402 |
1.5 |
52.2 |
|
0. Armed forces |
71 |
18 |
89 |
0.3 |
79.8 |
|
Total |
11349 |
14611 |
25960 |
100 |
43.7 |
Source: Prepared by the authors based on data from EILU (2019).
A Multi-Factor Analysis of Graduate Entry into the Labour Market: System Equity and the Persistence of Gender Inequalities
Table 8. Description of NACE occupations for men and women
|
Establishment’s main activity |
Man |
Woman |
Total |
% Total |
% Men |
|
Agriculture, forestry, sericulture and fishing |
146 |
129 |
275 |
1.1 |
53.1 |
|
Industry |
1035 |
629 |
1664 |
6.5 |
62.2 |
|
Electricity and water supply |
173 |
133 |
306 |
1.2 |
56.5 |
|
Construction |
713 |
389 |
1102 |
4.3 |
64.7 |
|
Wholesale and retail trade |
670 |
1033 |
1703 |
6.7 |
39.3 |
|
Transportation, storage, postal and courier activities |
303 |
195 |
498 |
1.9 |
60.8 |
|
Accommodation and food service activities |
194 |
416 |
610 |
2.4 |
31.8 |
|
Information and communication |
545 |
307 |
852 |
3.3 |
64 |
|
Financial activities |
458 |
423 |
881 |
3.4 |
52 |
|
Real estate activities |
96 |
127 |
223 |
0.9 |
43 |
|
Professional, scientific and technical activities |
1826 |
1628 |
3454 |
13.5 |
52.9 |
|
Photographic activities, veterinary activities, rental activities, employment activities, travel agency activities, security activities, building services |
473 |
644 |
1117 |
4.4 |
42.3 |
|
Office administrative and other business support activities |
297 |
457 |
754 |
2.9 |
39.4 |
|
Public administration and defence; social security |
787 |
994 |
1781 |
7 |
44.2 |
|
Education |
1499 |
3673 |
5172 |
20.2 |
29 |
|
Health and social work activities |
1062 |
2879 |
3941 |
15.4 |
26.9 |
|
Arts, cultural, recreation and sports activities |
367 |
420 |
787 |
3.1 |
46.6 |
|
Other activities |
181 |
295 |
476 |
1.9 |
38 |
|
Total |
10825 |
14771 |
25596 |
100 |
42.3 |
Source: Prepared by the authors based on data from EILU (2019).