Figure 1. Analysis model
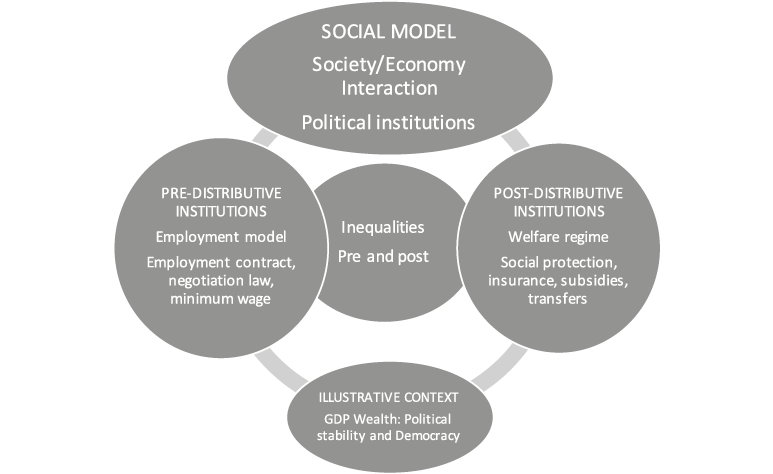
Source: Author’s own creation.
doi:10.5477/cis/reis.193.89-112
Socio-economic Models in Europe and Latin America. A Typology of Inequality and Instability
Modelos socioeconómicos en Europa y América Latina:
una tipología de la desigualdad e inestabilidad
Antonio Martín Artiles
|
Key words Social Coverage
|
Abstract This article compares employment models and welfare regimes in Europe and Latin America between 2008 and 2023. We underline three key points: First, distribution institutions and the ideal of egalitarian democracy have receded in all welfare regimes. Income inequalities stagnated or increased in Europe, while they fell in some Latin American countries. Second, the loss of union power resources correlates with the weakening of distributive institutions. Coordinated Economies models have sustained distribution better than Liberal Market Economies. Third, the main discriminating factors are occupational institutionality versus informality, further away the rates of occupational activity and the coverage of collective bargaining. In social institutions, five types are distinguished: high, medium-high, medium-low, low and very low. |
|
Palabras clave Cobertura social
|
Resumen Este artículo compara los modelos de empleo y regímenes de bienestar en Europa y Latinoamérica entre 2008 y 2023. Subrayamos tres puntos claves: primero, las instituciones de distribución y el ideal de democracia igualitaria han retrocedido en todos los regímenes de bienestar. Las desigualdades en los ingresos se estancaron o aumentaron en Europa, mientras que en algunos países de América Latina se redujeron; segundo, la pérdida de recursos de poder sindical correlaciona con el debilitamiento de las instituciones distributivas, los modelos de economías coordinadas han sostenido mejor la distribución que las economías liberales de mercado; y, tercero, los principales factores discriminantes son la institucionalidad social-laboral versus informalidad, a más distancia las tasas de actividad ocupacional y la cobertura de la negociación colectiva. En la institucionalidad social se distinguen cinco tipos: alta, media-alta, media-baja, baja y muy baja. |
Citation
Martín Artiles, Antonio (2026). “Socio-economic Models in Europe and Latin America. A Typology of Inequality and Instability”. Revista Española de Investigaciones Sociológicas, 193: 89-112. (doi: 10.5477/cis/reis.193.89-112)
Antonio Martín Artiles: Universitat Autònoma de Barcelona | antonio.martin@uab.es
Introduction1
This work is relevant given the inequalities in economic income which have tended to stagnate or even increase over recent years, following the financial crisis (2008-2015) and the COVID-19 pandemic (2020-2022). These crises have profoundly affected employment and redistributive institutions. Redistributive institutions such as those of health care, education, housing, pensions, and benefits have suffered from cutbacks in social spending as a result of the decline in gross domestic product in many countries. Economic policy responses have been different in both crises.
Between 2008 and 2023, two opposing economic policy orientations have been observed (Crouch, 2022; Pelke, 2023). On the one hand, during the years of the financial crisis, European governments encouraged neoliberal austerity policies, making cuts in public spending, reductions in the purchasing power of wages and freezing the creation of public employment. During this period, the priority was to reduce the deficit and public debt as much as possible. On the other hand, during the crisis caused by the pandemic, state intervention policies were undertaken in an attempt to maintain employment and public health. This highlighted the importance of collective goods and the tripartite social pact as a form of institutional mediation and economic governance (Eurofound, 2024). In other words, neo-corporatist practices were promoted (Meardi and Tassinari, 2022).
In short, both of these crises affected primary income, derived from the labor market, as well as post-distributive income, coming from cuts in welfare regimes. This article analyzes the interaction between pre-distributive and post-distributive institutions. A conceptual framework is provided to compare the employment models and welfare regimes of Latin America and Europe, examining how certain types of pre-distributive institutions generate primary inequalities in economic income and how other institutional arrangements foster post-distributive policies to mitigate these inequalities. This is a reference to an aspect of the varieties of capitalism and the types of socioeconomic institutions (Scharpf, 1992; Crouch, 1999; Hall and Soskice, 2001; Menz 2008; Bosch et al., 2009; Zalakain and Barragué, 2017).
Typologies and models have been criticized for their rigidity and inability to adapt to structural changes. In this work, we consider the institutional transformations arising from the financial crisis and the pandemic. We examine how they have affected social stakeholders, political stability, the management of wage coordination, and income inequalities.
This article has two main objectives: 1) To examine how income inequalities have changed between 2008 and 2023; 2) To identify the variables influencing the configuration of employment and welfare models.
It is assumed that this crisis context has modified distributive institutions. We show that changes in redistributive institutions and inequalities correlate with factors such as a declining Gross Domestic Product, rising unemployment, informality, labor market segmentation, the weakening of unions, a crisis of egalitarian democracy, an increase in populism, and political instability (Guillén et al., 2016; López-Roldán and Fachelli, 2021).
This text has been divided into four sections: theoretical approach and analysis model, descriptive results, classification of wellness and employment models and conclusions.
Theoretical approach
and analysis model
Using the following analysis model, we typify country clusters, providing a classification based on similarities and dissimilarities. This idea of a social model was inspired by the seminal works of Polanyi (1989), which explains the interrelationship between social institutions and market economies. The institutionalist perspective counters the paradigm of liberal economics and the supposed dominance of market logic. In short, Polanyi reminds us that “as a rule, the human economy is immersed in human relations” (1989).
Our analytical model distinguishes between pre-distributive institutions (labor market) and post-distributive institutions (welfare regime), which have a long tradition in the history of the labor and trade union movements of Europe and Latin America (see Figure 1). In Europe, the institutionalization of labor and welfare law has been taking place since the 1950s and 1960s (Piketty, 2019), hand in hand with social democracy and Christian democracy (the Keynesian-Fordist pact). In Argentina, Brazil and Uruguay, a process of industrialization and development of corporatist social protection was initiated (Martínez-Franzoni, 2007; Cruz Martínez, et al., 2024).
1. Pre-distributive institutions. Throughout the history of pre-distributive institutions, the employment contract has played a fundamental role in the 20th century. The contractual formalization of employment has been the core of labor law. This has been a major advance, in addition to the rights to trade unions, participation, information, consultation and collective bargaining. In addition to the historic achievements accomplished through the formalization of the inter-professional minimum wage, the advancement of thee rights, linked to pre-distributive institutions, has been embodied through significant milestones such as the Versailles Treaty (1919), the creation of the ILO and the Declaration of Philadelphia (1944), etc. These significant advances were made following the Second World War and have helped to mitigate inequalities in pre-distributive income and reduce wage dispersion (Piketty, 2019). In terms of Industrial Democracy, however, the most notable advances have been made in some of the countries having co-determination and co-management company rights. This is the case with the Scandinavian countries, Germany and Austria, etc. (Sanz et al., 2020; Eurofound, 2024). The expansion of these pre-distributive institutions has been linked to cross-class alliances between unions and socialist and Christian socialist parties in Europe. In Latin America, some labor institutions have developed alongside social movements, as is the case of Peronism in Argentina, Vargasism in Brazil, and Batllism in Uruguay. However, in Latin America, labor and social institutions tend to be very weak (Presbich, 1981; Martínez, 2019).
However, through the institutionalization of labor relations, social conflicts have been channeled and the coordination of wage policies with macroeconomic objectives has been facilitated in Western Europe. In Argentina and Uruguay, some social pacts were made in the 1980s and 1990s (Etchemendy, 2019). In short, the pre-distributive institutions have highlighted the fact that work is a social relationship as opposed to a commercial one (Polanyi, 1989; Piketty, 2019).
2. Post-distributive institutions. The origin of post-distributive institutions is linked to social policies, which have been created in an attempt to correct the inequalities generated by the labor market. This is evident in the history of the construction of the Bismarckian and Beveridgian welfare states in the 1950s and 1960s (Scharpf, 1992; Crouch, 1999; Esping-Andersen, 2000; Piketty, 2019, etc.). Pre-distributive institutions have been and continue to be important but are insufficient to revert primary inequalities (Ruiz-Huertas et al., 2015). Therefore, through industrial democracy, post-distributive rights have been introduced, such as employment insurance, retirement pensions, health, maternity and disability insurance, and transfers of subsidies to families. These social benefits may be considered forms of deferred wages in welfare schemes financed by worker contributions (Bismarckian regimes) or general taxes (Beveridgian regimes). Over recent decades, however, these institutions have eroded. There are diverse causes of this: job insecurity, unemployment, technological change, and the predominance of neoliberal policies.
Towards an employment and welfare model typology
Historically, social institutions have been shaped by the relationships of conflict and pacts with social classes. Today we can identify four major models of employment and welfare regimes, which are as follows:
First, the liberal employment model is characterized by its weak pre-distributive institutions, with a microeconomic orientation. It involves a company-level wage negotiation system, low collective bargaining coverage rate, weak unions and limited intervention in the economy (Priewe, 2024). This model, found in the United States, the United Kingdom and Canada, relies on the market and reveals major inequalities in economic income. This Beveridgian-type welfare system is assistance-based, relies on public and private insurance systems, and is financed through general taxes and individual contributions, respectively (Scharp, 1992; Crouch, 1999).
Second, the coordinated employment model is distinguished by its hierarchical system of economic governance, which stands out for its state intervention in the labor market and social protection (Hall and Soskice, 2001). It also relies on social protection systems that contribute to and motivate the increase in productivity. All of this has influenced the stabilization of the economy during the crisis periods (Ruiz-Huertas et al., 2015). Syndicates play a key role in this model, in terms of wage coordination and inflation control. The model, used in Scandinavian and Germanic countries, is characterized by high union membership rates and a tradition of Social Pacts, promoting equitable economic development. In Scandinavian countries, the Beveridgian-type welfare system is used, whereas in Social Partnership countries (Austria, Germany, Belgium, Slovenia, etc.) the corporatist-Bismarckian type is implemented. Ideologically, it was initially influenced in large part by the social doctrine of the Church and is currently based on proportional contributions of active workers (Crouch, 1999; Esping-Andersen, 2000).
Third, we can consider the existence of a mixed model, with coordinated employment, but with segmented labor markets. The distinguishing feature of these economies is their precarious employment, with a certain volume of informal economy and low wages. It is found in southern European countries such as France, Italy, Spain and Portugal. Macroeconomic governance is based on a system of governance that is specific to the economy, as coordinated through social consultation. It relies on a corporatist-Bismarckian-type welfare regime, although it includes the participation of families and the support of religious institutions that participate in welfare policy (Ferrera, 1996; Meardi and Tassinari, 2022).
And fourth, we can consider the heterogeneous employment model. In Latin America, capitalism is characterized by a “structural heterogeneity” (Prebisch, 1981; Marqués and Chávez 2019; Cruz-Martínez et al., 2024), which implies a structural imbalance with large sectorial differences in productivity. It is a combination of formal and informal economies, distrust of institutions, dual labor markets, local markets, and vestiges of pre-capitalist economies. This generates a large pre-distributive inequality, low levels of productivity, low wages, income concentration, external economic dependence and technological delays.
The governance of this model is complex. The political elite have an extractive imprint, which hinders the culture of the social pact (Acemoglu and Robinson, 2012; Etchemendy, 2019). This is a legacy of the colonial past, although since the 1940s, some countries have managed to form a certain corporatist culture. Today, the result is a segmented or even dualized welfare regime (Martínez-Franzoni, 2007; Martínez-Franzoni and Sánchez-Ancochea, 2016).
Operationalization of variables
In this analysis model, we consider eighteen variables (Kaufmann et al., 2010; López-Roldán and Fachelli, 2015). The data correspond to 35 countries. The analysis model is organized in four interacting dimensions. In Table 1, the following dimensions are shown: employment model, welfare regimes, inequalities and context. Below, we present a description of the institutional variables (normative) used for factorial analysis, classification and regression (see in the Appendix Tables 1A, 2A and 3A).
Trends in welfare regimes
and inequalities
Trend in welfare regimes and inequalities
Welfare regimes are in decline, according to V-Dem data (2023) which provides the Index of Redistributive Institutions (includes housing, education, health, pensions and subsidies). In the set of 35 countries studied, this index fell by 5.7 % in 2023, as compared to 2008 (using a base index of 100). The largest decline appears to have taken place in housing provision, but it also occurred in other areas. This may be a consequence of the austerity policies implemented during the Great Recession.
The Figure 2 reveals that primary inequalities are very high and tended to increase slightly after the two major crises. This growth in pre-distributive inequalities correlates with unemployment, the loss of wage purchasing power, and the trend toward reduced collective bargaining coverage. In contrast, post-distributive inequalities have decreased very slightly over the same period. Latin American countries, which enjoyed a period of economic growth between 2008 and 2015, have contributed in large part to this reduction. The financial crisis affected them to a lesser degree or for a much shorter period than European countries.
In Table 2, it is shown that the primary inequalities, measured by the pre-distributive Gini index, rise above the average (0.50) in all of the Latin American countries, characterized by a very high occupational informality. This consequently weakens the tax base and hinders income distribution, as previously demonstrated during the “lost decades” of the 1970s and 1980s (Etchemendy, 2019).
In contrast, the Scandinavian social democratic and social partnership countries also display high primary inequalities, but they remain well below the average. This may be explained by the virtue of their formal employment and tripartite governance model. However, factors such as labor laws, informal employment, the decline in union power and the decentralization of collective bargaining have contributed to increasing inequalities. Therefore, the current introduction of the minimum interprofessional wage by decree-law in countries such as the United Kingdom (1999) and Germany (2015) is highly relevant. This has been a political response made in an attempt to reduce inequalities. The debate over the minimum wage and the idea of a “living minimum” is a relevant aspect of the debate in order to avoid falling below the poverty line (Piketty, 2019).
Between 2008 and 2023, primary inequalities increased in countries such as Denmark, Ireland, the US, Italy, Lithuania, Bulgaria, and Costa Rica. This indicates a deterioration of employment and wages.
Regarding post-distributional inequalities, Latin American countries are found to be above average in this respect. Mediterranean countries also appear slightly above the average for these inequalities. During the aforementioned period, post-distributive inequalities increased in Denmark, Sweden, Norway, Austria, and Bulgaria, among others, indicating a decline in income redistribution. However, efforts were made to correct post-distributive inequalities in Scandinavia and Germany and serve as a benchmark for egalitarian ideologies. In 2023, the countries achieving the greatest percentage of correction in relative post-distributive inequalities (compared to 2008 = base 100) were Denmark and Estonia (44 %), Mexico (43 %), Slovenia (43 %), and the Netherlands (43 %). The countries that were the least successful in reducing inequalities were Argentina (18 %), Brazil, and Norway.
Figure 3 shows the trend for post-distributive inequalities to increase as occupational informality increases. Latin American countries remain very much above the average, having extremely high rates of informal employment, and therefore, very high rates of inequalities. On the contrary, countries with low informal employment rates (Scandinavian and central European) tend to have low levels of inequalities in their post-distributive income. Occupational informality is a burden for distributive institutions for several reasons: i) a lack of employment contracts hinders access to labor and social rights; however, ii) it serves as a fast track to job insertion for the unemployed and immigrants; iii) it facilitates access to immediate income; iv) informality also provides an opportunity for low-cap entrepreneurship; v) it tends to spread in countries with low confidence in political institutions and vi) it serves as a means to evade taxes and labor regulations. Informality can even be a means of complementarity with the formal economy, facilitating cost reduction (ELA, 2023).
In summary, post-distributive inequality correlates positively and significantly with informality (r = 0.701) and unemployment rate (0.392). Conversely, inequality decreases as the tax rate increases (-0.666), the population is covered by at least social security insurance (-0.693), and collective bargaining coverage increases (-0.498). Regarding contextual variables, inequality correlates with political instability (-0.563) and a decline of democracy, according to public opinion (-0.500), which affects long-term redistributive legitimacy. Likewise, the level of per capita income has a strong and significant negative correlation (r-0.608) with post-distributive inequalities.
Similarities and dissimilarities between employment and welfare models
The following cluster analysis provides an additional view of the similarities, dissimilarities, closeness, and distance between countries and their redistribution models to construct a typology. Based on Ward’s hierarchical method, the classification reveals four clusters (see Figure 4).
Liberal and transitional regimes
This group includes fifteen countries, although two subgroups may be distinguished. The first is made up of liberal countries (Canada, the United Kingdom, the United States, Ireland, the Netherlands, and Slovenia), and the second is made up of Eastern European countries (Bulgaria, the Czech Republic, Hungary, Slovakia, Estonia, Lithuania, Poland, and Romania), considered to be in “post-communist transition”, which have now adopted institutional patterns having some similarities to liberal countries (see Tables 1A, 2A, and 3A in the Appendix).
1) Liberal employment model: Liberal Anglo-Saxon countries are characterized by a low level of microeconomic wage coordination (at the company level). Therefore, they have a low rate of collective bargaining coverage and low union membership. The collective power of the working and middle classes is weak. Furthermore, they have low public employment levels. Salaries are medium-high ($52,785). In the United States, they are very high, at $60,000, as also occurs in the United Kingdom, at $53,000. Overall, these countries have high labor participation rates and low levels of informal employment. Traditionally, they prioritize pre-distributive policies through the labor market, based on the belief that “a rising tide lifts all boats” (Piketty, 2019: 44).
2) Anglo-Saxon liberal welfare regimes: Redistribution institutions have a medium-high rating, with a tradition of welfare policies in the United Kingdom, Ireland and Canada (Beveridgian type). Social security coverage is also medium-high, although the ideal of egalitarian democracy is average. Tax burden is below average, in line with current neoliberal discourse. However, between 2008 and 2023, they tended to increase taxes (2 %) in response to the financial and COVID crises (see Table 3). The percentage of the population living under the poverty level is low (13 %). These countries tend to have high individualist2 values, tolerating some degree of inequality (Piketty, 2019). It should be noted that the US (a reference country for the neoliberal paradigm) displays high pre- and post-distributive inequalities: it is below average in spending, taxation, social insurance coverage, and the index of redistributive institutions (see tables in the Appendix). This contrasts with the high level of per capita wealth (64,765 dollars).
3) Trends in liberal regimes from 2008 to 2023: Redistributive institutions have regressed in all of these countries. The ideal of egalitarian democracy has declined markedly in the United States, with income inequality increasing despite rising per capita income levels. The political stability has declined considerably in this country, especially following the assault on Congress. The public’s assessment of democracy has also declined (-29 %) and the index of redistributive institutions has also decreased (-7 %).
Regarding the Eastern European countries, they have adopted institutions that having similarities to those of the liberal type, such as the microeconomic orientation and the decentralization of collective bargaining. It is a heterogeneous conglomerate with high levels of informal employment and poverty in some of the countries, such as Romania, Bulgaria, Estonia and Latvia. The primary inequality is quite high, and the average gross wage is quite low (15,528 dollars), at half of the overall average. The per capita GDP is equally low (32,916) as is its recent democratic culture (see tables from Appendix).
Social democratic regimes and social paternariat
The second cluster, situated considerably further away, includes countries of a social democratic tradition (Denmark, Sweden, Norway and Finland) and the so-called Social Paternariat (Partnership). These countries include Germany, Austria and Belgium.
State pay-as-you-go regime in Southern Europe
This conglomerate includes France, Italy, Spain, Portugal, Greece and Croatia, making up the so-called Mediterranean model. It is a mixed model, having coordinated employment, but segmented labor markets, with precarious jobs, a relevant volume of informal economy and low wages. However, these countries have governance systems that are typical of coordinated economies through social consultation and collective bargaining. They rely on a corporatist-Bismarckian welfare system that is “family-based”: includes the participation of families and support from the Third Sector, such as religious institutions in the provision of assistance (Ferrera, 1996; Meardi and Tassinari 2022).
Dual employment and welfare regimes
This conglomerate is made up of the dual regimes: Argentina, Brazil, Chile, Costa Rica, Mexico, Uruguay, and Bolivia. Although differences exist with respect to the degree of institutionalization, they share the problem of occupational informality. These countries continue to have an extractive economic elite, which is a legacy of colonial political culture (Acemoglu and Robinson, 2012). Furthermore, they display a heterogeneous economic structure, with a significant, export-oriented agricultural sector.
On the other hand, informality has decreased in Argentina and Brazil (OECD, 2019). Mexico has reduced inequality thanks to the increase in the minimum wage taking place during the Morena administration over the last six years4. Insurance and social benefit coverage is low throughout Latin America. In Argentina, the financial crisis of union social welfare organizations (a legacy of Peronist corporatism) currently threatens health coverage. Tax rates have increased significantly in Uruguay and to a lesser extent in other countries. However, they have been reduced in Brazil and Bolivia.
In Latin America, welfare policies are generally used in the absence of stable social security systems (Chávez and Molina 2008; Cruz Martínez et al., 2024). In this region, cynicism with democracy is correlated with informality, political instability, and autocracy, as corroborated by various researchers (Martínez-Fronzoni and Sánchez-Ancochea, 2016; Bohigues, 2021; V-Dem, 2023).
The following principal components analysis allows us to reduce the complexity of the active variables (mentioned in Table 1) into three components that explain the greatest variability of the data (72 %). The KMO test (0.742) reveals a high correlation between the variables selected in the model, indicating its suitability for the object of study.
On the other hand, in the following spatial distribution of the principal components (see Figure 5) the importance of social-labor institutionality as a variable related to income inequality is evidenced (Martínez, 2019).
First, three subgroups may be distinguished: Mexico and Bolivia have very low social and labor institutionality, followed by Brazil, Chile, and Costa Rica with low institutionality and then Argentina and Uruguay, having medium-low institutionality.
Second, the column with medium-high social and labor institutionality includes the statist Mediterranean countries and the liberal countries. Finally, the column with high social and labor institutionality includes the social democratic countries and the social partnership.
The work participation and unemployment component reveals that liberal countries have high work participation rates while, on the contrary, Mediterranean countries have low rates.
Stagnation with a tendency towards growing inequalities
We have shown that primary inequalities tend to increase in Europe, which is associated with the decline of Industrial Democracy, as well as the fall in the level of per capita income.
In contrast, in Latin America, some countries have reduced their primary inequalities and their (still very high) post-distributive inequalities. Autocratic regimes are growing in different countries, and in general, the appreciation of democracy is declining (Bohigues, 2021; Peña, 2022; V-Dem, 2023b).
Post-distributive inequalities have stagnated in Europe and have even increased in certain countries. Many years of neoliberal policies have marked a trend that may be described as a transition from the socialization of protection to the individualization of risk.
Regarding institutional coordination mechanisms (between the labor market and social protection), we can conclude that the degree of wage coordination, the level of collective bargaining, the extension clauses in agreements, and state intervention (taxation) all play a relevant role in defining social models. However, these mechanisms have been eroding, losing their redistributive effectiveness.
Effects of changes after two crises
Regarding the first objective, we have demonstrated that countries with liberal market economies have reduced the assessment of their redistributive institutions, more than countries with coordinated economies. Liberal regimes have opted for economic growth placing a greater emphasis on employment activation policies.
Regarding regime changes, we have shown that the distributive institutions of the Nordic regime have regressed slightly toward the ideal of egalitarian democracy. One of the risks for these countries is increased political instability and the decline in union power resources. The decline in distribution institutions has been much more pronounced in Southern European countries, where their ideal of egalitarian democracy has also declined.
In Latin America, Uruguay has the highest level of social and labor institutionalization. In recent years, it has managed to reduce inequality and informality and improve its political stability. Thus far, Argentina has had a medium-low level of social and labor institutionalization. But it is currently entering uncertain territory given the combination of political instability, informality, low taxation, public debt, and alarming inflation. The current ultra-liberal autocratic government is threatening the country’s medium-to-low institutional structure.
Differentiating factors between the models
Regarding the second objective, it is found that the main principal component is the level of social-labor institutionality, which plays a notable role in the shaping of the models. At some distance from this, we find the work participation rates versus unemployment and the centralized versus decentralized wage coordination.
It may be concluded that occupational informality represents the “pure market” ideal: a corrosive acid for institutions of redistributive solidarity. This problem is more acute in Latin America and, to a much lesser extent, in Southern Europe. Informality affects taxation and social rights, leading to uncertainty, loss of trust in institutions, political instability, and corruption. Occupational informality implies social informality. On the contrary, the formality of the employment contract contributes to access to social rights, facilitates tax contributions, provides access to pension systems, access to redistribution, and facilitates other collective benefits such as union representation, collective bargaining, wage coordination, stability, and trust in the political system. Therefore, the legal formality of employment contracts is key to the sustainability of redistributive solidarity systems. The redistribution of wealth and the institutional participation of social stakeholders are essential for political stability and democracy.
Acemoglu, Daron and Robinson, James (2012). Por qué fracasan los países. Barcelona: Grupo Planeta.
Bohigues, Asbel (2021). Élites, radicalismo y democracia. Madrid: Centro de Investigaciones Sociológicas.
Bosch, Gerdhard; Lehndorff, Steffen and Rubery, Jill (ed.) (2009). European Employment Models in Flux. London: Palgrave Macmillan.
Campillo, Inés and Sola, Jorge (2020). “La teoría de recursos de poder: una revisión crítica”. Revista Española de Investigaciones Sociológicas, 170: 19-34. Available at: https://reis.cis.es/index.php/reis/article/view/470, access May 15, 2024.
Chávez, Eduardo and Molina, Pablo (2008). “Nosotros los de antes ya no somos los mismos. Pobreza y desigualdad en la Argentina postcrisis”. Espacio Abierto Cuaderno de Sociología, 17(4): 663-696.
Colin, Crouch (2022). “Reflections on the Covid moment and life beyond neoliberalism”. Transfer Review, 28(1): 31-46. Available at: https://journals.sagepub.com/doi/full/10.1177/10242589221078125, access May 10, 2023.
Crouch, Colin (1999). Social Change in Western Europe. Oxford: Oxford University Press.
Cruz-Martínez, Gibran; Vargas-Faulbaum, Luis and Velasco, Juan (2024). Estado de Bienestar en América Latina: Regímenes de bienestar, trayectorias históricas y arquitecturas de política social. In: E. del Pino and M. J. Rubio Lara (eds.). Estado de Bienestar en la Encrucijada: Políticas sociales en perspectiva comparada (pp. 205-232). Madrid: Tecnos.
ELA (2023). Extend undeclared work in the European Union. European Platform tackling undeclared work. Brussels: European Labour Authority.
Esping-Andersen, Gosta (2000). Los fundamentos de las sociedades postindustriales. Barcelona: Ariel.
Etchemendy, Sebastián (2019). “Coordinación Salarial Gubernamental e Intersectorial en el Neo-Corporativismo Segmentado: Orígenes y Desempeño en Argentina y Uruguay (2005-2015)”. Revista SAAP, 13(2): 341-380.
Ferrera, Maurizio (1996). “The Southern Model of Welfare in Social Europe”. Journal of European Social Policy, 6(1): 17-37. doi: 10.1177/095892879600600102
Guillén, Ana; Gonzáles-Begega, Sergio and Luque, David (2016). “Austeridad y ajustes sociales en el Sur de Europa. La fragmentación del modelo de bienestar Mediterráneo”. Revista Española de Sociología, 25(2): 261-272. Available at: https://fes-sociologia.com/uploads/public/DEBATE%20n25%20Prensa%201-12.pdf, access May 10, 2023.
Hall, Peter and Soskice, David (2001). Varieties of capitalism. Oxford Scholarship Online, November 2003. doi: 10.1093/0199247757.001.0001
Kaufmann, Daniel; Aart, Kraay and Mastruzzi, Massimo (2010). “The Worldwide Governance Indicators: A Summary of Methodology, Data and Analytical Issues”. World Bank Policy Research Working Paper, N. 5430. Available at: http://papers.ssrn.com/sol3/papers.cfm?abstract_id=1682130, access April 5, 2023.
López-Roldán, Pedro and Fachelli, Sandra (2015). Metodología de la investigación social cuantitativa. Barcelona: Universitat Autònoma de Barcelona. Available at: https://ddd.uab.cat, access April 5, 2023.
López-Roldán, Pedro and Fachelli, Sandra (2021). A general model for the Comparative analysis of social inequalities between Europe and Latin America. In: P. López-Roldan and S. Fachelli. Towards a comparative analysis of social inequalities between Europe and Latin America (pp.3-34). Luxembourg: Springer. doi: 10.1007/978-3-030-48442-2
Marqués, Idelfonso and Chávez, Eduardo (2019). “Relevancia de la heterogeneidad socioeconómica: Estudio comparativo entre América Latina y Europa basado en la adaptación del Esquema EHP”. Revista Papers, 104(2): 225-245. Available at: https://papers.uab.cat/article/view/v104-n2-marques-chavez, access April 5, 2023.
Martínez-Fronzoni, Juliana (2007). Regímenes de bienestar en América Latina. Madrid: Fundación Carolina, document no. 11.
Martínez-Fronzoni, Juliana and Sánchez-Ancochea, Diego (2016). Regímenes de bienestar en América Latina. Tensiones entre universalización y segmentación. In: E. del Pino and J. Rubio (eds.). Los estados de bienestar en la encrucijada: políticas sociales en perspectiva comparada (pp.200-220). Madrid: Tecnos.
Martínez, Rodrigo (2019). La institucionalidad social en América Latina. Santiago de Chile: United Nations ECLAC. Available at: https://www.cepal.org/es/publicaciones/3767-institucionalidad-social-america-latina, access February 3, 2023.
Meardi, Guglielmo and Tassinari, Ariannna (2022). “Crisis Corporatism 2.0? The Role of Social Dialogue in the Pandemic Crisis in Europe”. Transfer, 28(1): 83-100. Available at: https://journals.sagepub.com/doi/abs/10.1177/10242589221089785, access February 3, 2023.
Menz, George (2008). Varieties of capitalism and Europeanisation. Oxford: Oxford University Press.
OECD/ILO (2019). Tackling Vulnerability in the Informal Economy, Development Centre Studies. Paris: OECD Publishing. doi: 10.1787/939b7bcd-en
Pelke, Lars (2023). “Reanalysing the Link Between Democracy and Economic Development”. International Area Studies Review, 26(4): 361-383. Available at: https://journals.sagepub.com/doi/10.1177/22338659231194945, access February 2, 2023.
Peña, Ricardo (2022). “On the State of Democracy in the World before and after the Great Recession”. The Varieties Democracy Institute, University of Goteborg. Working Paper series, 47. Available at: www.v-dem.net, access February 2, 2023.
Piketty, Thomas (2019). Capital e Ideología. Barcelona: Editorial Planeta.
Polanyi, Karl (1989). La Gran Transformación. Madrid: La Piqueta.
Prebisch, Raul (1981). Capitalismo periférico. Crisis y transformación. Mexico: Fondo de Cultura Económica.
Priewe, Jan (2024). “Comparing living and working conditions: Germany outperforms the United States”. IMK Study, No. 91, Hans-Böckler-Stiftung. Dusseldorf: Institut für Makroökonomie und Konjunkturforschung (IMK).
Ruiz-Huerta, Jesús; Ayala, Luis and Loscos, Javier (2015). Estado del Bienestar y sistemas fiscales en Europa. Madrid: Consejo Económico y Social.
Sanz, Pablo; Welz, Christian; Caprile, Maria and Rodríguez, Ricardo (2020). “Industrial De-mocracy in Europe”. Labour and Industry, 30(2): 101–132. doi: 10.080/10301763.2020.1774101
Scharpf, Fritz (1992). Socialdemocracia y crisis en Europa. Valencia: Edicions Alfons El Magnànim.
V-Dem (2023b). Resistencia frente a la autocratización. Santiago de Chile: Pontifical Catholic University of Chile. Available at: https://laoms.org/resistencia-frente-la-autocratizacion/, access November 20, 2024.
Zalakain, Joseba and Barragué, Borja (2017). Repensar las políticas sociales. Madrid: Grupo 5.
OECD (2023a). Wage coordination. ICTWSS database. Database on Institutional Characteristics of Trade Unions, Wage Setting, State Intervention and Social Pacts. Amsterdam Institute for Advanced Labour Studies. OECD/AIAS. Available at: https://data.oecd.org/, access November 20, 2024.
OECD (2023b). Collective bargaining coverage. OECD/AIAS. Available at: https://data.oecd.org/, access November 20, 2024.
OECD (2023c). Unions memberships: OECD/AIAS. Available at: https://data.oecd.org/, access November 20, 2024.
OECD (2023d). Informal occupation. Outlook. Available at: https://data.oecd.org/, access November 20, 2024.
OECD (2023e). Unemployment rate. Outlook. Available at: https://data.oecd.org/, access November 20, 2024.
OECD (2023f). GDP per capita. OECD Outlook. Available at: https://data.oecd.org/, access November 20, 2024.
World Bank (2023a). Occupation rate: World Bank. Available at: https://data.worldbank.org/indicator/SL.UEMTOLT.ZS, access November 22, 2024.
World Bank (2023b). Gini Index. Before and after taxes (2008-2023). Available at: https://ourwoorldindata.org, access November 22, 2024.
World Bank (2023c). Political stability index. World Bank. Available at: https://www.govindicators.org, access November 22, 2024.
World Bank (2023d). Wages. Poverty line. Our World in Data. Available at: https://data.worldbank.org/indicator/, access November 22, 2024.
V-Dem (2023a). Egalitarian Institutional Index; redistributive index; egalitarian democracy. V-Dem, Sweden. Available at: https://ourwoorldindata.org, access November 22, 2024.
1 Professor Emeritus, Institut Estudis del Treball, Universitat Autònoma de Barcelona. INCASI II project. Marie Sklodowska-Curie Actions, H2020-MSCA-RISE, GA-101130456.
2 The US, receiving 91 points in the ranking of individualism, comes in first place. It is followed, with respect to individualistic values, by the United Kingdom (89 points); Netherlands (80); Hungary (80) and Ireland (70). See the World Population Rank 2014. Available at: https:worldpopulationreview.com/country-rankings/individualistic-countries
3 The Latin American barometer suggests distrust in institutions and the political system. See the November 2021 report, available at: https://www.minsait.com/ideasfordemocracy/es/informe-2021-latinobarometro
4 Suárez, Karina: “Una bandera de la lucha social en México” (A flag of social struggle in Mexico). El País, 9/3/2025.
Figure 1. Analysis model
Source: Author’s own creation.
TablE 1. Dimensions and indicatiors: Active Dimensions: Employment model; Welfare and Inequalities. Ilustrative dimensions: Context
|
Dimension |
Indicator type |
Indicator |
Justification |
Source |
|
Pre-distributive dimension: Employment model |
Normative (2023) |
Level of salary coordination (1=company and 5=central) |
The centralized or decentralized level of wage setting affects equality |
(OECD 2023a) |
|
Normative (2023) |
Collective Bargaining Coverage Rate |
Workers protected by collective bargaining agreements. Effectiveness of protection |
(OECD 2023b) |
|
|
Representation (2023) |
Union membership rate |
Workers’ association. Organized power, a counterbalance to corporate power |
(OECD 2023c) |
|
|
Normative |
Public employment rate |
Protected employment |
OECD (2023d) |
|
|
Anti-normative (2023) |
Informal occupation rate |
Lack of employment contract and legal employment coverage. Non-contributory |
OECD (2023d) |
|
|
Normative (2023) |
Occupation rate |
Active workers in the market |
World Bank (2023a) |
|
|
Normative (2023) |
Unemployment rate |
Uncertainty, vulnerability |
OECD (2023b) |
|
|
Normative |
Gross wages |
Inequalities between countries |
World Bank (2023a) |
|
|
Post-distributive Dimension II: Welfare Regime |
Redistributive institutional (2023) |
Index Institutions equal distribution |
Institutional level of Education, Health, Pensions, Housing, etc. |
V-Dem (2023a) |
|
Ideological cultural (2023) |
Individualism versus collectivism |
Attitudes towards solidarity redistribution |
V-Dem (2023a) |
|
|
Normative |
Tax rate |
Contribution |
Our World in data |
|
|
Redistributive institutional (2023) |
Population protected by social security |
Degree of effectiveness of social institutions |
||
|
Institutional 2023 |
Social Spending Rate |
Redistribution |
OECD, Our World in data |
|
|
Dimension III: Inequalities |
Income inequality (2008-2023) Post inequality |
Pre Gini index Post Gini Index |
Inequalities |
OECD |
|
Dimension IV |
Political (2008-2023) |
Political stability |
Political instability 2008-2022. Institutional crisis of governance |
World Bank (2023b) |
|
Political |
Democracy assessment |
Public opinion |
Our World in data, V-Dem 2024 |
|
|
Contextual (2008-2023) |
Gross Domestic Product per capita |
Estimated level of wealth, recession and growth |
OECD (2023f) |
Source: Author’s own creation with cited data.
Figure 2. Gini Index pre- and post-distributive, 2008-2023 (Coefficients)
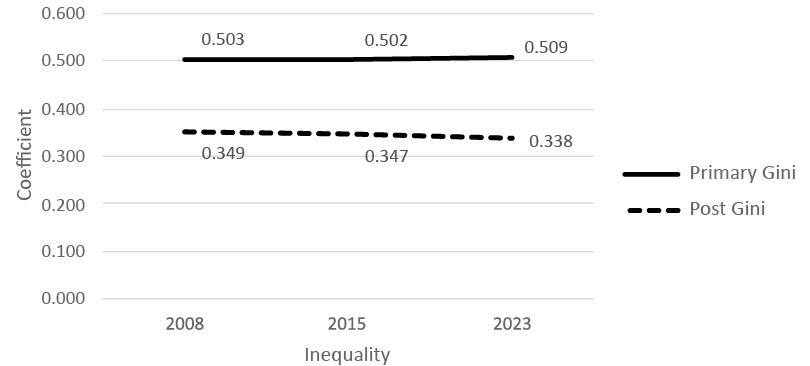
Source: Author’s own creation with data cited from the 35 countries under study.
Table 2. Pre-distributive and post-distributive income 2008 to 2023
|
|
Country |
Primary Gini 2008 |
Primary Gini 2023 |
Primary Gini variations. 2008=base 100 (%) |
Post Gini 2008 |
Post Gini 2008 |
Post Gini variations 2008-2023 (5) |
Annual Correction Pre and post Gini 2023 (%) |
|
1. Latin America |
Argentina |
0.59 |
0.56 |
-5 |
0.45 |
0.46 |
2 |
18 |
|
Bolivia |
0.65 |
0.65 |
0 |
0.51 |
0.41 |
-20 |
37 |
|
|
Brazil |
0.68 |
0.68 |
0 |
0.51 |
0.52 |
1 |
24 |
|
|
Chile |
0.74 |
0.71 |
-4 |
0.47 |
0.43 |
-9 |
40 |
|
|
Costa Rica |
0.66 |
0.72 |
9 |
0.49 |
0.47 |
-5 |
35 |
|
|
Mexico |
0.76 |
0.75 |
-2 |
0.51 |
0.43 |
-16 |
43 |
|
|
Uruguay |
0.62 |
0.58 |
-7 |
0.45 |
0.41 |
-9 |
30 |
|
|
2. Partnership |
Austria |
0.46 |
0.44 |
-4 |
0.3 |
0.31 |
3 |
30 |
|
Belgium |
0.43 |
0.41 |
-5 |
0.28 |
0.27 |
-4 |
35 |
|
|
Germany |
0.48 |
0.46 |
-4 |
0.31 |
0.32 |
3 |
31 |
|
|
Netherlands |
0.41 |
0.45 |
9 |
0.29 |
0.26 |
-11 |
43 |
|
|
Slovenia |
0.38 |
0.42 |
11 |
0.24 |
0.24 |
0 |
43 |
|
|
3. S.D. |
Denmark |
0.4 |
0.5 |
25 |
0.25 |
0.28 |
12 |
44 |
|
Finland |
0.43 |
0.41 |
-5 |
0.28 |
0.28 |
0 |
32 |
|
|
Sweden |
0.41 |
0.44 |
7 |
0.28 |
0.3 |
7 |
32 |
|
|
Norway |
0.42 |
0.33 |
-22 |
0.27 |
0.28 |
3 |
16 |
|
|
Eastern European |
Bulgaria |
0.47 |
0.55 |
17 |
0.34 |
0.39 |
14 |
30 |
|
Czech Republic |
0.38 |
0.41 |
7 |
0.26 |
0.26 |
0 |
37 |
|
|
Estonia |
0.5 |
0.5 |
0 |
0.32 |
0.32 |
0 |
44 |
|
|
Croatia |
0.46 |
0.46 |
0 |
0.33 |
0.29 |
-13 |
37 |
|
|
Latvia |
0.52 |
0.48 |
-8 |
0.36 |
0.34 |
-6 |
30 |
|
|
Lithuania |
0.5 |
0.62 |
24 |
0.36 |
0.37 |
2 |
41 |
|
|
Poland |
0.5 |
0.47 |
-6 |
0.33 |
0.28 |
-16 |
41 |
|
|
Romania |
0.56 |
0.5 |
-21 |
0.36 |
0.34 |
-5 |
32 |
|
|
Slovakia |
0.39 |
0.37 |
-6 |
0.26 |
0.24 |
-8 |
36 |
|
|
Liberal |
Ireland |
0.46 |
0.52 |
13 |
0.32 |
0.3 |
-7 |
43 |
|
United Kingdom |
0.48 |
0.46 |
-5 |
0.35 |
0.32 |
-9 |
32 |
|
|
United States |
0.56 |
0.63 |
12 |
0.41 |
0.4 |
-3 |
37 |
|
|
Canada |
0.51 |
0.5 |
-2 |
0.34 |
0.32 |
-6 |
36 |
|
|
Southern European |
France |
0.45 |
0.46 |
2 |
0.33 |
0.32 |
-4 |
31 |
|
Spain |
0.45 |
0.46 |
2 |
0.34 |
0.34 |
0 |
36 |
|
|
Italy |
0.48 |
0.53 |
10 |
0.34 |
0.35 |
2 |
34 |
|
|
Portugal |
0.49 |
0.47 |
-4 |
0.37 |
0.35 |
-6 |
26 |
|
|
Greece |
0.46 |
0.46 |
0 |
0.34 |
0.33 |
-3 |
29 |
|
|
Average |
0.5 |
0.51 |
2 |
0.35 |
0.34 |
-3 |
34.2 |
|
Source: Author’s own creation with cited data. The data for Latin America refers to the urban Gini index.
Figure 3. Occupational informality and inequality in economic income
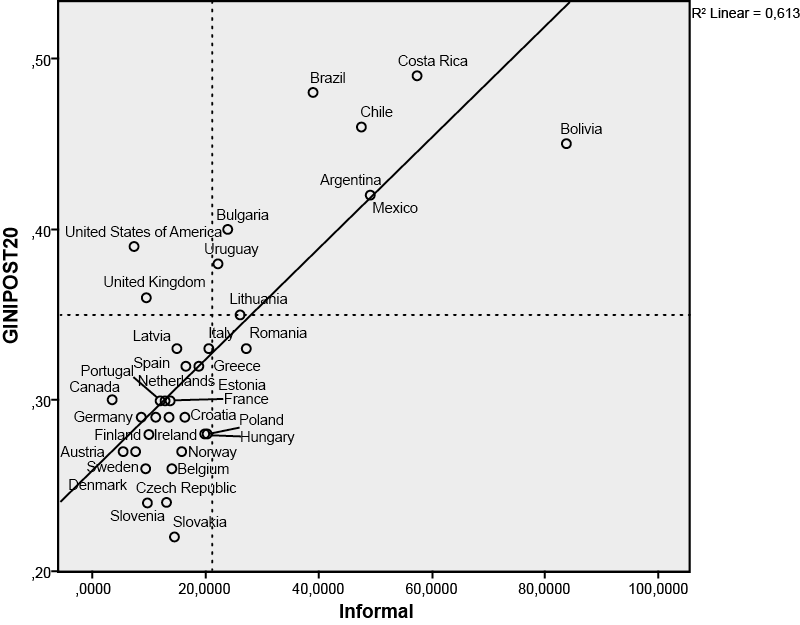
Source: Author’s own creation with cited data. Data on informal employment in Europe and Latin America come from OECD employment estimates (2023d). Informal occupation. Outlook, available at: https://data.oecd.org/, see also OECD (2019) and ELA (2023).
Figure 4. Dendrogram
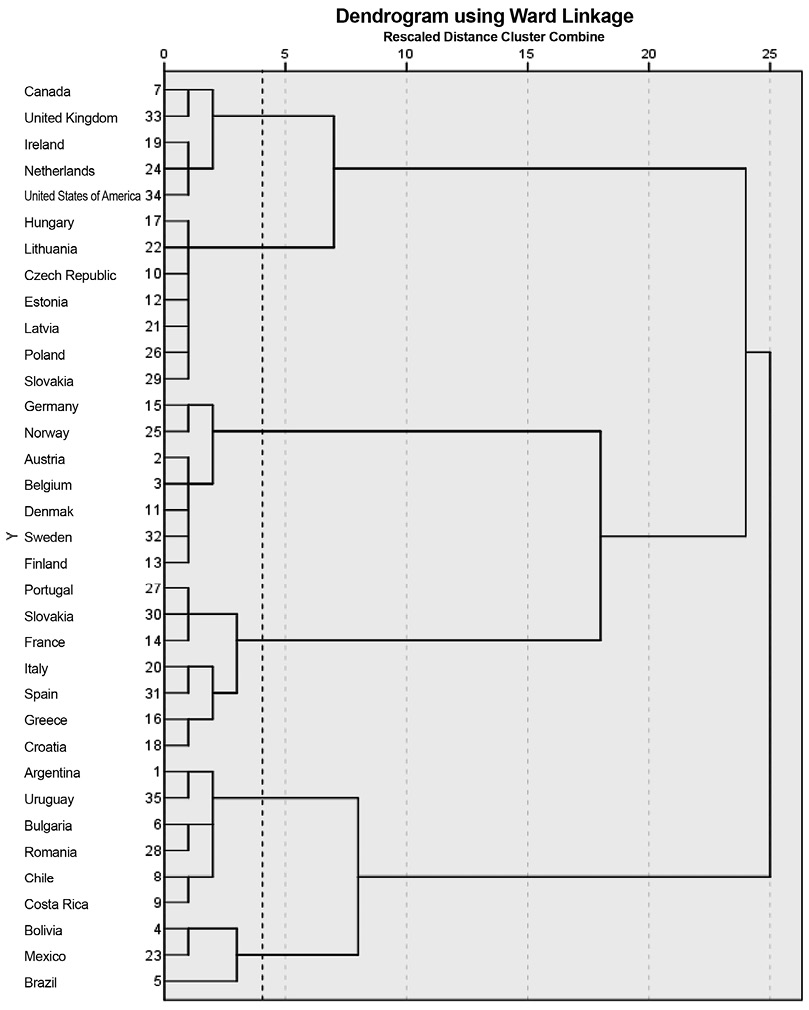
Source: Author’s own creation with cited data. KMO test (Active Dimensions I, II and III).
Table 3. Relative changes in 2023 as compared to 2008 in the liberal countries (relative changes in %)
|
Distribution |
Ideal |
Gini |
CPI |
Stability |
Opinion of democracy |
Taxation |
NC Coverage |
|
|
United |
-7 ٪ |
-20 ٪ |
-3 ٪ |
26.2 ٪ |
-73.0 ٪ |
-29 ٪ |
2 ٪ |
-20 ٪ |
|
Canada |
-5 ٪ |
-26 ٪ |
-2 ٪ |
21.0 ٪ |
-6.0 ٪ |
-15 ٪ |
5 ٪ |
0 ٪ |
|
United |
-6 ٪ |
1 ٪ |
2.9 ٪ |
9.4 ٪ |
2.0 ٪ |
-22 ٪ |
2 ٪ |
-21 ٪ |
|
Ireland |
-1 ٪ |
-6 ٪ |
-5 ٪ |
10.1 ٪ |
-26.0 ٪ |
14 ٪ |
-5 ٪ |
-20 ٪ |
|
Netherlands |
-5 ٪ |
-5 ٪ |
-11 ٪ |
13.8 ٪ |
-16.0 ٪ |
-13 ٪ |
10 ٪ |
-8 ٪ |
Source: Author’s own creation with cited data. 2008=Base 100.
Table 4. Main relative changes between 2008 and 2023. Variation % (2008= base 100)
|
Redistribution |
Ideal |
Gini |
CPI |
Stability |
Democratic value |
Taxation |
NC Coverage |
|
|
Germany |
1 ٪ |
-6 ٪ |
3 |
13.4 ٪ |
-35.0 ٪ |
-8 ٪ |
5 ٪ |
-12 ٪ |
|
Denmark |
-3 ٪ |
-1 ٪ |
9 |
23.2 ٪ |
-19.0 ٪ |
0 ٪ |
4 ٪ |
-2 ٪ |
|
Norway |
-15 ٪ |
0 ٪ |
3 |
3.0 ٪ |
-34.0 ٪ |
14 ٪ |
1 ٪ |
-7 ٪ |
|
Austria |
-4 ٪ |
-8 ٪ |
-2 |
3.0 ٪ |
-53.0 ٪ |
-16 ٪ |
3 ٪ |
-7 ٪ |
|
Finland |
-2 ٪ |
-5 ٪ |
3 |
13.6 ٪ |
-39.0 ٪ |
7 ٪ |
4 ٪ |
1.0 ٪ |
|
Sweden |
-3 ٪ |
-7 ٪ |
1 |
22.7 ٪ |
-22.0 ٪ |
6 ٪ |
-3 ٪ |
-2 ٪ |
Source: Author’s own creation with cited data.
Table 5. Relative changes in 2023, with respect to 2008 (base 100) (in %)
|
Distribution |
Democratic ideal |
Post Gini |
CPI |
Stability |
Democratic opinion |
NC Coverage Rate |
|
|
Portugal |
-8 ٪ |
-11 ٪ |
-5 |
10.50 ٪ |
-14 ٪ |
-9 ٪ |
-23 ٪ |
|
Spain |
-4 ٪ |
-11 ٪ |
1 |
-2.40 ٪ |
29 ٪ |
-15 ٪ |
0 ٪ |
|
France |
-10 ٪ |
-5 ٪ |
-7 |
9.70 ٪ |
-39 ٪ |
-9 ٪ |
0 ٪ |
|
Italy |
2 ٪ |
-1 ٪ |
4 |
6.8 ٪ |
-25 ٪ |
-8 ٪ |
0 ٪ |
Source: Author’s own creation with cited data: 2008= base 100.
Table 6. Changes in distributive institutions and employment institutions (2008-2023) (in %). Base 2008=100
|
Redistribution |
Ideal Egalitarian Democracy |
Post Gini |
CPI |
Stability |
Social Security |
Opinion of democracy |
Taxation rate |
|
|
Argentina |
4 ٪ |
2 ٪ |
-5.6 |
-7.00 ٪ |
10 ٪ |
-13 |
-44 ٪ |
5 ٪ |
|
Chile |
2 ٪ |
-7 ٪ |
-2 |
23.00 ٪ |
-73 ٪ |
20 |
-10 ٪ |
10 ٪ |
|
Bolivia |
1 ٪ |
-18 ٪ |
-19 |
29 ٪ |
4 ٪ |
48 |
-67 ٪ |
-19 ٪ |
|
Brazil |
-٨ ٪ |
-47 ٪ |
-4 |
4.00 ٪ |
-6 ٪ |
-3 |
-22 ٪ |
-3 ٪ |
|
Uruguay |
-5 ٪ |
-29 ٪ |
-11.2 |
32.00 ٪ |
29 ٪ |
0 |
9 ٪ |
20 ٪ |
Source: Author’s own creation with cited data.
Table 7. Squared Euclidean distance matrix (reference Spain)
|
Spain |
0.000 |
|
Italy |
0.539 |
|
Portugal |
1.593 |
|
Uruguay |
2.094 |
|
Argentina |
4.378 |
|
Costa Rica |
4.438 |
|
Chile |
6.937 |
|
Brazil |
9.493 |
|
Bolivia |
16.914 |
|
Mexico |
18.082 |
Source: Author’s own creation with 15 active variables.
Table 8. Main components
|
|
Components |
||
|
1 |
2 |
3 |
|
|
Collective bargaining coverage rate |
0.748 |
0.367 |
0.317 |
|
Wage coordination |
0.717 |
0.167 |
0.482 |
|
Trade union affiliation |
0.629 |
0.041 |
0.584 |
|
Tax rate |
0.915 |
0.172 |
-0.088 |
|
Pre Gini |
-0.826 |
0.158 |
0.329 |
|
Post Gini |
-0.736 |
0.391 |
0.333 |
|
Social spending |
0.720 |
0.444 |
0.146 |
|
% Population with insurance |
0.712 |
-0.374 |
-0.172 |
|
Redistributive Equality Institutions |
0.795 |
-0.022 |
-0.243 |
|
Ideal Equal Democracy |
0.760 |
-0.055 |
0.063 |
|
Activity rate |
-0.066 |
-0.755 |
0.443 |
|
Unemployment rate |
0.224 |
0.806 |
-0.246 |
|
Occupational Informality Rate |
-0.790 |
0.212 |
0.373 |
|
Public employment rate |
0.570 |
-0.076 |
-0.043 |
|
Gross salary in dollars |
0.733 |
-0.237 |
0.290 |
Source: Author’s own creation, with cited data with 15 active variables.
Figure 5. Spatial distribution of components of labor-social institutions and employment activation
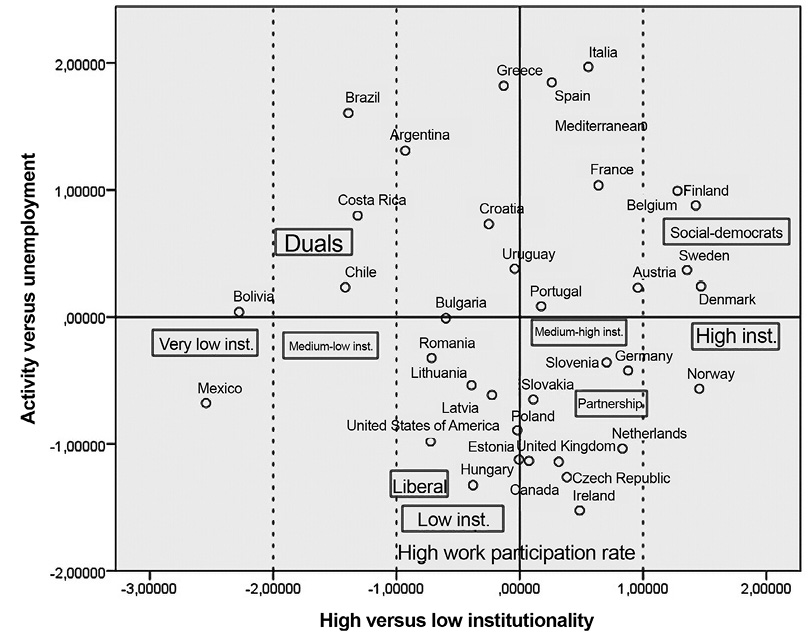
Source: Author’s own creation, with cited data.
RECEPTION: October 15, 2024
REVIEW: March 6, 2025
ACCEPTANCE: May 5, 2025
Table 1a. Employment model
|
Wage coord. |
Union affiliation |
NC coverage |
Unemployment |
T-Activ. |
Public Emp. |
Informal |
Pre Gini |
Gross Salary |
||
|
1. Liberal and post-communist transition |
Canada |
1.00 |
27.20 |
31.00 |
5.40 |
62.00 |
19.87 |
3.50 |
0.50 |
42718 |
|
United Kingdom |
1.00 |
23.30 |
27.00 |
4.10 |
60.00 |
15.98 |
9.50 |
0.46 |
53599 |
|
|
United States |
1.00 |
10.30 |
12.00 |
3.60 |
59.00 |
14.91 |
7.30 |
0.63 |
60220 |
|
|
Ireland |
3.00 |
26.20 |
34.00 |
3.60 |
62.00 |
14.91 |
11.10 |
0.52 |
53324 |
|
|
Netherland |
4.00 |
16.50 |
76.00 |
3.60 |
63.00 |
11.71 |
12.80 |
0.45 |
62642 |
|
|
Slovenia |
3.00 |
23.80 |
79.00 |
3.60 |
57.00 |
16.74 |
13.00 |
0.42 |
23329 |
|
|
Total |
2.17 |
21.22 |
43.17 |
3.98 |
60.50 |
15.69 |
9.53 |
0.50 |
49305 |
|
|
Bulgaria |
2.00 |
15.30 |
28.00 |
4.30 |
54.00 |
21.10 |
23.80 |
0.55 |
10724 |
|
|
Czech Republic |
2.00 |
11.40 |
35.00 |
2.60 |
59.00 |
16.57 |
9.60 |
0.41 |
17331 |
|
|
Hungary |
1.00 |
9.20 |
22.00 |
4.10 |
58.00 |
18.86 |
20.10 |
0.44 |
16272 |
|
|
Slovakia |
3.00 |
16.70 |
24.00 |
5.80 |
58.00 |
19.00 |
14.50 |
0.37 |
15077 |
|
|
Estonia |
1.00 |
4.50 |
19.00 |
6.30 |
62.00 |
22.70 |
16.40 |
0.50 |
19002 |
|
|
Latvia |
1.00 |
11.60 |
27.00 |
6.50 |
57.00 |
19.61 |
14.90 |
0.48 |
14749 |
|
|
Lithuania |
1.00 |
10.00 |
27.00 |
7.00 |
58.00 |
21.92 |
26.00 |
0.62 |
18761 |
|
|
Poland |
1.00 |
13.40 |
13.00 |
2.90 |
57.00 |
17.25 |
19.70 |
0.47 |
15620 |
|
|
Romania |
2.00 |
21.40 |
15.00 |
5.60 |
49.00 |
16.00 |
27.10 |
0.50 |
12216 |
|
|
Total |
1.56 |
12.61 |
23.33 |
5.01 |
56.89 |
19.22 |
19.12 |
0.48 |
15528 |
|
|
٢. Social Democrat and Paternariat |
Germany |
4.00 |
16.60 |
54.00 |
5.30 |
59.00 |
10.63 |
8.60 |
0.46 |
59513 |
|
Austria |
4.00 |
26.30 |
98.00 |
5.20 |
58.00 |
16.67 |
5.30 |
0.44 |
55577 |
|
|
Belgium |
5.00 |
49.10 |
96.00 |
5.50 |
52.00 |
18.29 |
14.00 |
0.41 |
54506 |
|
|
Denmark |
4.00 |
67.50 |
82.00 |
5.10 |
61.00 |
27.61 |
9.30 |
0.50 |
66812 |
|
|
Finland |
5.00 |
62.90 |
89.00 |
7.20 |
56.00 |
24.24 |
9.90 |
0.41 |
52220 |
|
|
Norway |
4.00 |
50.00 |
69.00 |
3.60 |
63.00 |
32.20 |
15.80 |
0.33 |
66603 |
|
|
Sweden |
4.00 |
65.50 |
88.00 |
7.60 |
61.00 |
28.66 |
7.50 |
0.44 |
50570 |
|
|
Total |
4.29 |
48.27 |
82.29 |
5.64 |
58.57 |
22.61 |
10.06 |
0.43 |
57972 |
|
|
٣. Southern Europe |
Croatia |
1.00 |
26.50 |
53.00 |
6.10 |
49.00 |
29.80 |
13.50 |
0.46 |
17714 |
|
Spain |
3.00 |
13.00 |
80.00 |
12.10 |
50.00 |
15.58 |
16.50 |
0.46 |
30764 |
|
|
France |
2.00 |
10.80 |
98.00 |
7.30 |
52.00 |
21.23 |
13.60 |
0.46 |
43618 |
|
|
Italy |
3.00 |
32.60 |
100.00 |
7.60 |
45.00 |
13.21 |
20.40 |
0.53 |
34532 |
|
|
Greece |
2.00 |
10.00 |
14.00 |
11.00 |
45.00 |
16.65 |
18.80 |
0.46 |
24145 |
|
|
Portugal |
2.00 |
15.40 |
77.00 |
6.50 |
55.00 |
14.07 |
12.00 |
0.47 |
22247 |
|
|
Total |
2.37 |
23.39 |
48.26 |
5.55 |
56.83 |
17.86 |
21.20 |
0.51 |
30648 |
|
|
4. AL: Heterogeneous dual regimes |
Argentina |
3.00 |
27.70 |
49.00 |
6.20 |
56.00 |
17.80 |
49.00 |
0.56 |
8316 |
|
Brazil |
3.00 |
12.70 |
70.00 |
8.00 |
58.00 |
12.10 |
38.90 |
0.68 |
5373 |
|
|
Chile |
1.00 |
16.60 |
20.00 |
5.20 |
55.00 |
9.40 |
47.50 |
0.71 |
12917 |
|
|
Costa Rica |
1.00 |
20.50 |
10.00 |
5.40 |
55.00 |
12.40 |
57.30 |
0.72 |
12917 |
|
|
Mexico |
1.00 |
12.00 |
10.00 |
2.80 |
59.00 |
12.50 |
49.00 |
0.75 |
6105 |
|
|
Uruguay |
3.00 |
30.10 |
60.00 |
4.50 |
58.00 |
15.70 |
22.10 |
0.58 |
5244 |
|
|
Bolivia |
1.00 |
12.00 |
3.00 |
3.10 |
67.00 |
9.40 |
83.70 |
0.65 |
4332 |
|
|
Total |
0.14 |
18.71 |
31.71 |
5.00 |
58.29 |
12.76 |
49.64 |
0.66 |
7886 |
|
|
Overall total |
2.37 |
23.39 |
48.26 |
5.55 |
56.83 |
17.86 |
21.20 |
0.51 |
30648 |
|
Source: Author’s own creation, with cited data.
Table 2a. Welfare regimes
|
Post Gini |
Poverty line |
Social spending |
Tax rate |
% Pop. prot. |
Equal resources |
||
|
1. Liberal and in transition |
Canada |
0,32 |
9,40 |
18,57 |
33,00 |
99,80 |
0,89 |
|
United Kingdom |
0,32 |
18,60 |
19,29 |
34,30 |
93,50 |
0,84 |
|
|
United States |
0,40 |
12,70 |
18,49 |
26,80 |
76,10 |
0,57 |
|
|
Ireland |
0,30 |
14,00 |
12,87 |
29,10 |
90,10 |
0,84 |
|
|
Netherlands |
0,26 |
14,50 |
16,32 |
40,20 |
97,50 |
0,90 |
|
|
Slovenia |
0,24 |
12,70 |
21,47 |
37,80 |
100,00 |
0,90 |
|
|
Total |
0,31 |
13,65 |
17,84 |
33,53 |
92,83 |
0,82 |
|
|
1 bis. Transition |
Bulgaria |
0,39 |
20,60 |
19,50 |
30,30 |
88,30 |
0,74 |
|
Czech Republic |
0,26 |
10,20 |
19,46 |
33,90 |
88,80 |
0,96 |
|
|
Hungary |
0,29 |
12,10 |
17,64 |
34,10 |
86,20 |
0,63 |
|
|
Slovakia |
0,24 |
12,20 |
17,45 |
35,60 |
92,10 |
0,83 |
|
|
Estonia |
0,32 |
22,50 |
17,91 |
33,80 |
98,40 |
0,95 |
|
|
Latvia |
0,34 |
22,50 |
16,52 |
30,90 |
96,50 |
0,81 |
|
|
Lithuania |
0,37 |
20,00 |
16,99 |
32,70 |
92,70 |
0,81 |
|
|
Poland |
0,28 |
11,80 |
21,19 |
37,80 |
84,90 |
0,84 |
|
|
Romania |
0,34 |
23,50 |
13,30 |
27,10 |
95,00 |
0,61 |
|
|
Total |
0,31 |
17,27 |
17,77 |
32,91 |
91,43 |
0,80 |
|
|
2. Social Democrat and Social Partnership |
Germany |
0,32 |
14,80 |
25,59 |
40,90 |
99,50 |
0,95 |
|
Austria |
0,31 |
14,80 |
27,71 |
43,70 |
98,60 |
0,89 |
|
|
Belgium |
0,27 |
12,30 |
28,22 |
44,90 |
100,00 |
0,95 |
|
|
Denmark |
0,28 |
12,40 |
28,44 |
48,00 |
89,50 |
0,98 |
|
|
Finland |
0,28 |
12,20 |
29,42 |
43,20 |
100,00 |
0,81 |
|
|
Norway |
0,28 |
12,90 |
25,28 |
41,60 |
95,80 |
0,98 |
|
|
Sweden |
0,30 |
16,10 |
25,07 |
43,00 |
100,00 |
0,90 |
|
|
Total |
0,29 |
13,64 |
27,10 |
43,61 |
97,63 |
0,92 |
|
|
3. Southern Europe |
Croatia |
0,29 |
18,00 |
24,00 |
35,30 |
56,00 |
0,85 |
|
Spain |
0,34 |
20,20 |
24,65 |
38,90 |
80,90 |
0,89 |
|
|
France |
0,32 |
15,60 |
30,74 |
47,30 |
100,00 |
0,80 |
|
|
Italy |
0,35 |
20,10 |
27,73 |
43,30 |
82,00 |
0,91 |
|
|
Greece |
0,33 |
18,80 |
25,08 |
39,20 |
64,00 |
0,92 |
|
|
Portugal |
0,35 |
16,40 |
22,34 |
37,40 |
90,20 |
0,85 |
|
|
Total |
0,33 |
18,80 |
25,08 |
39,20 |
64,00 |
0,05 |
|
|
4. LA |
Argentina |
0,46 |
39,20 |
22,34 |
29,10 |
58,40 |
0,74 |
|
Brazil |
0,52 |
27,50 |
21,37 |
32,60 |
69,90 |
0,51 |
|
|
Chile |
0,43 |
10,80 |
11,71 |
20,80 |
70,20 |
0,61 |
|
|
Costa Rica |
0,47 |
25,50 |
11,88 |
14,20 |
58,00 |
0,61 |
|
|
Mexico |
0,43 |
36,30 |
7,36 |
13,90 |
62,40 |
0,29 |
|
|
Uruguay |
0,41 |
9,90 |
20,34 |
26,80 |
93,80 |
0,89 |
|
|
Bolivia |
0,41 |
39,00 |
22,20 |
20,30 |
46,60 |
0,38 |
|
|
Total |
0,45 |
26,89 |
16,74 |
22,53 |
65,61 |
0,58 |
|
|
Overall total |
0,34 |
18,00 |
20,81 |
34,34 |
85,59 |
0,80 |
|
Source: Author’s own creation, with cited data.
Table 3a. Contextual variables
|
Political stability |
Democratic culture index |
CPI GDP |
||
|
1. Liberal |
Canada |
0.77 |
7.50 |
46808.00 |
|
United Kingdom |
0.50 |
6.88 |
45225.00 |
|
|
United States |
-0.04 |
6.25 |
64765.00 |
|
|
Ireland |
0.88 |
10.00 |
76169.00 |
|
|
Netherlands |
0.72 |
8.75 |
55979.00 |
|
|
Slovenia |
0.71 |
6.25 |
39746.00 |
|
|
Total |
0.72 |
7.88 |
52785.40 |
|
|
1bis. Liberal transition |
Bulgaria |
0.25 |
4.38 |
23079.00 |
|
Czech Republic |
0.82 |
7.50 |
38745.00 |
|
|
Hungary |
0.84 |
6.88 |
32789.00 |
|
|
Slovakia |
0.44 |
5.63 |
30690.00 |
|
|
Estonia |
0.72 |
6.88 |
38048.00 |
|
|
Latvia |
0.48 |
6.25 |
32803.00 |
|
|
Lithuania |
0.65 |
5.63 |
37031.00 |
|
|
Poland |
0.50 |
6.25 |
33034.00 |
|
|
Romania |
0.49 |
3.75 |
30027.00 |
|
|
Total |
0.58 |
5.91 |
32916.22 |
|
|
2. Social Democrat and Social Partnership |
Germany |
0.61 |
8.13 |
54534.00 |
|
Austria |
0.64 |
6.88 |
53619.00 |
|
|
Belgium |
0.58 |
6.88 |
52293.00 |
|
|
Denmark |
0.87 |
9.38 |
60365.00 |
|
|
Finland |
0.89 |
9.38 |
49452.00 |
|
|
Norway |
0.86 |
10.00 |
64660.00 |
|
|
Sweden |
0.90 |
10.00 |
54489.00 |
|
|
Total |
0.76 |
8.66 |
55630.29 |
|
|
3. Southern Europe |
Croatia |
0.61 |
4.38 |
30132.00 |
|
Spain |
0.27 |
7.50 |
38354.00 |
|
|
France |
0.33 |
6.88 |
45937.00 |
|
|
Italy |
0.41 |
7.50 |
42840.00 |
|
|
Greece |
0.06 |
7.50 |
29002.00 |
|
|
Portugal |
0.86 |
6.88 |
33135.00 |
|
|
Total |
0.42 |
6.77 |
36566.67 |
|
|
4. Dual |
Argentina |
-0.01 |
3.75 |
20925.00 |
|
Brazil |
-0.33 |
5.00 |
14370.00 |
|
|
Chile |
0.12 |
6.88 |
24563.00 |
|
|
Costa Rica |
0.95 |
6.88 |
19974.00 |
|
|
Mexico |
-0.69 |
1.88 |
17896.00 |
|
|
Uruguay |
1.10 |
6.88 |
21269.00 |
|
|
Bolivia |
-0.28 |
1.25 |
3841.00 |
|
|
Total |
0.12 |
4.65 |
17548.29 |
|
|
Overall average |
0.50 |
6.65 |
38759.66 |
|
Source: Author’s own creation, with cited data.