Analysis of Crime Levels Among the Adult Population in Spain According to Nationality (2007-2023)
Análisis de los niveles de delincuencia de la población adulta
en España según nacionalidad (2007-2023)
Jesús Javier Sánchez Barricarte
|
Key words Delinquency
|
Abstract This study examines the relationship between immigration and crime in Spain, with particular attention to the role of demographic, structural, and socioeconomic factors. The results suggest that differences in crude crime rates between the foreign-born and native-born adult populations are substantially reduced when standardized by age and sex. This suggests that the different demographic composition accounts for a large share of the observed gap. Considerable heterogeneity is also identified by geographical origin, and no association is observed between irregular immigration and crime. Factors such as poverty, social exclusion, and urbanization emerge as consistent predictors. These findings underscore the need for evidence-based policies, including regularization and social integration measures, to reduce tension and promote cohesion. The empirical evidence challenges the simplistic narrative linking immigration to crime, underscoring the importance of data-driven policies. |
|
Palabras clave Delincuencia
|
Resumen Este estudio analiza la relación entre inmigración y delincuencia en España, con especial atención al impacto de factores demográficos, estructurales y socioeconómicos. Los resultados indican que las diferencias en las tasas brutas de delincuencia de la población adulta extranjera y autóctona se reducen en gran medida al estandarizar por edad y sexo, lo que sugiere que la distinta composición demográfica contribuye sustantivamente a la brecha observada. Asimismo, se aprecia una considerable heterogeneidad según el origen geográfico, y no se halla una asociación entre inmigración irregular y delincuencia. Factores como la pobreza, la exclusión social y el grado de urbanización se presentan como predictores consistentes. El estudio destaca la necesidad de políticas basadas en evidencia, como la regularización migratoria y la integración social, para reducir tensiones y fomentar la cohesión. Aporta evidencia empírica que cuestiona la narrativa simplista que vincula inmigración con criminalidad y subraya la importancia de políticas basadas en datos. |
Citation
Sánchez Barricarte, Jesús Javier (2026). «Analysis of Crime Levels Among the Adult Population in Spain According to Nationality (2007-2023)». Revista Española de Investigaciones Sociológicas, 195: 103-134. (doi: 10.5477/cis/reis.195.103-134)
Jesús Javier Sánchez Barricarte: Universidad Carlos III de Madrid | jesusjavier.sanchez@uc3m.es
Introduction1
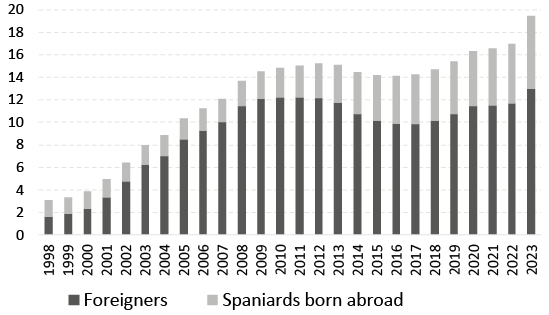
Since the 1990s, Spain has undergone a profound sociodemographic transformation driven by sustained immigration flows. As a result, the country represents a key case for examining the relationship between immigration and integration in Europe. In 1998, foreigners accounted for only 1.6 % of the population. However, by 2023, this figure had risen to 13 %. During this period, the percentage of Spaniards born abroad also increased, rising from 1.5 % to 6.5 % (see Figure 1). According to data from the Permanent Observatory of Immigration (OPI), an estimated 2.05 million people obtained Spanish nationality through residence between 2007 and 2023.
Given the growing demand for young workers driven by Spain’s aging population, immigration to this country is expected to continue over the coming decades, regardless of any restrictive policies that may be implemented by future governments.
According to a survey conducted by SocioMétrica in July 2025, 73 % of Spaniards considered the number of immigrants to be excessive, and 81 % supported stricter measures targeting illegal immigration (Ruiz Coll, 2025). These findings underscore the influence of social perceptions on the debate over immigration.
In Europe and the United States, immigration has often led to polarized discourse linking it with increased insecurity. However, scientific research suggests a more nuanced situation. Most studies find no direct link between immigration and crime (Maghularia and Übelmesser, 2019) and some have even suggested that immigration may contribute to reducing crime rates (Ousey and Kubrin, 2018).
Despite the importance of this issue, few empirical studies have examined the relationship between immigration and crime in Spain. García España (2020 and 2024) has conducted extensive research on the topic, offering valuable theories for the debate. She argues that immigration may contribute to reducing crime, although empirical evidence supporting this claim in Spain remains limited.
Alonso Borrego, Garoupa and Vázquez (2012) analyzed the impact of immigration on crime rates at a provincial level between 1999 and 2009. After considering various socioeconomic variables, they concluded that the increase in the immigrant population did not have a significant impact on serious crimes. They highlighted the importance of language and education in promoting integration.
After interviewing 173 immigrants, García España, Aguilar-Jurado and Contreras-
Román (2020) determined that crime is mainly linked to a lack of social cohesion and high levels of neighborhood conflict.
This study addresses the existing gap in the literature by conducting a quantitative analysis of the relationship between immigration and crime in Spain. Demographic, structural, and socioeconomic factors are incorporated.
Theoretical framework
Various theories have explained a possible increase or decrease in crime associated with immigration. Among the theories supporting an increase in crime, the demographic profile predisposed to crime stands out. According to this theory, immigration increases the proportion of the population in age groups that are at a higher risk of criminal behavior, such as adolescents and young adults (Ousey and Kubrin, 2009).
Social disorganization theory suggests that, by increasing cultural diversity and residence mobility, immigration complicates community cohesion and the development of shared values. These conditions supposedly weaken social mechanisms for crime control and prevention, especially in host communities with high linguistic and cultural diversity (Sampson, 2008).
From an economic perspective, some studies have suggested that immigration may intensify labor competition in sectors having a high concentration of low-skilled workers. This, in turn may generate social and economic tension between the native and immigrant populations (Butcher and Piehl, 1998).
The life chance theory argues that the obstacles faced by immigrants in society (such as discrimination or a lack of access to education and employment) may lead to crime (Ousey and Kubrin, 2009).
Conversely, some theories argue that immigration in fact, reduces crime. Positive selection theory suggests that immigrants are typically motivated, young, and less likely to commit crimes, given that they seek to improve their lives (Chiswick, 1999). Furthermore, the economic benefits of immigration, such as filling jobs rejected by the native population and stimulating growth, encourage stability and reduce crime (Butcher and Piehl, 1998). The fear of deportation is likely to deter immigrants from committing crimes, and their integration into the labor market reduces the time available to commit offenses.
Methodology and sources
Kubrin and Ousey (2023) argue that longitudinal research following the same individuals over a prolonged period is the most appropriate approach to use for this topic. This method, however, has various limitations, since it requires long-term follow-up and substantial resources, complicating its implementation. Therefore, most available research has been cross-sectional, relying on data from different generations of migrants at specific points in time. Given the available information, this study uses a cross-sectional analysis.
Analyzing the relationship between immigration and crime presents certain methodological challenges, especially in terms of measurement. According to the International Organization for Migration, an immigrant is an individual who moves their habitual residence to another country; therefore, not all foreigners in Spain are immigrants.
Another challenge refers to the measurement of crime. We have calculated the crude crime rates for each period as follows:

For the numerator in this study, the following has been used: “Statistics on Convicted Persons: Adults” from Spain’s National Institute of Statistics (INE). This database provides annual information on the sociodemographic characteristics of individuals who have been definitively convicted. Approximately 5.6 million crimes resulting in convictions between 2007 and 2023 have been analyzed. This study prioritizes the analysis of crimes over that of convicted individuals, since the same individual may have committed several crimes during the same period.
Data from municipal registers (INE) were used to calculate the denominator. Registration with the municipal register permits access to essential services and may be key to regularizing residency, given that it proves legal status in Spain. Therefore, it is a fundamental tool for quantifying and analyzing the resident population, including undocumented immigrants.
This study uses the following two complementary methodological approaches:
- Multiple regression analysis.
- Calculation of standardized crime rates according to the nationality of offenders.
Multiple regression analysis
We estimated two multiple regression models to quantify the association between the crude crime rate and a set of socioeconomic variables. The following information was compiled for the fifty Spanish provinces and the cities of Ceuta and Melilla (data obtained from the INE):
Dependent variable:
“Crude crime rate” of the total population aged 18 or over per one hundred thousand inhabitants during the 2020-2022 period (all crimes).
Independent variables:
(unless otherwise specified, the following data refers to the 2018-2020 period).
- % Foreigners: percentage of foreigners aged 18 and over registered in each province.
- Percentage of foreigners originating from different geographical areas:
- % EU countries without Spain.
- % European countries (not EU).
- % Africa.
- % Latin America.
- % Asia.
- Mean age: Mean age of the total population aged 18 and over.
- Sex ratio: number of males per one hundred females in the total population aged 18 and over.
- % City: Percentage of the total population that resides in cities with total populations of fifty thousand or more inhabitants in 2021.
- Unemployment rate: Mean unemployment rate of the total population (Labor Force Survey, EPA).
- Education: Percentage of the total population aged 20 and over having completed higher education studies in vocational or university settings in 2021.
Multiple regression analysis was performed using data from court rulings during the 2020-2022 period, using sociodemographic indicators corresponding to 2018-2020 as independent variables. This lag reflects the average duration of judicial proceedings (2.3 years according to the General Council of the Judiciary). It seeks to approximate the real context in which the sentenced crimes occurred in order to better interpret the factors associated with criminality.
Regression analysis is used to determine whether the presence of a foreign population is statistically associated with provincial crime rates, while controlling for covariates. Given the higher incidence of crime among males and young people (Ousey and Kubrin, 2009), we have included the following variables in the model: “mean age” and “sex ratio”. Furthermore, because the intensity of crime varies between rural and urban areas (Ceccato, 2015), and the economic context associated with variations in crime levels (Torres-Téllez, 2023), two additional variables have been included: the percentage of the population residing in cities of fifty thousand or more inhabitants, and the unemployment rate. Finally, we have included a variable that reflects the population’s educational level, since numerous studies have found negative associations between educational level and criminality (Ruiz Morales, 2018). The results of the regression analysis, expressed in standardized beta values, are shown in Table 1. For further details, refer to Tables A1 and A2 found in the online appendix.
TABLE 1. Estimates of the brute crime rate
|
Variable |
Model 1 |
Model 2 |
|
z%Foreigners |
0.078 |
|
|
z%EU countries without Spain |
-0.085 |
|
|
z%European countries minus the EU |
1.046 * |
|
|
z%Africa |
-0.753 |
|
|
z%Latin America |
-0.179 |
|
|
z%Asia |
-0.055 |
|
|
zMean Age |
-0.355 • |
-0.483 ** |
|
Sex ratio |
0.043 |
-0.077 |
|
z%City |
0.430 *** |
0.355 *** |
|
zUnemployment Rate |
0.218 |
0.037 |
|
zEducation |
0.084 |
0.149 |
|
--- |
--- |
--- |
|
Adjusted R2 |
0.629 |
0.707 |
P value < 0.001***; < 0.01**; < 0.05*; < 0.1•.
Source: Author’s own creation based on data from the INE.
In the first model, the “% Foreigners” variable was not statistically significant. In this context, no robust independent association with the rate was observed when considering the other covariates. This finding coincides with the results reported by Alonso Borrego, Garoupa and Vázquez (2012).
The second model, which offers a breakdown of immigration by region of origin, provides a more detailed analysis. Here, a positive and statistically significant association is observed between the presence of individuals from the population referred to as “Europe not EU” and crime rates. This link may be related to the existence of organized crime networks.
However, for other groups, such as those coming from Africa, Asia, EU countries or Latin America, the coefficients were not statistically significant. This indicates that there is no evidence of a clear independent association with the rate in the specified model. These results underscore the need for a more nuanced approach. In these models, the most consistent predictors are urbanization and median age. The percentage of foreign-born population does not show a robust independent association. Although Ruiz Morales (2018) found educational quality to be a relevant factor in reducing criminality, our models (Table 1) show no statistically significant association with educational level.
Standardized crime rates
by nationality
Treating the foreign population in Spain as a homogeneous group entails a serious methodological risk, as it may conceal the considerable diversity in the socioeconomic and demographic conditions of its members. To address this issue, it is essential to calculate crime rates disaggregated by the geographical origin of the population subgroups.
Because crime is a variable that is highly influenced by factors such as age and sex, and since the demographic structure of the different subgroups making up the resident population in Spain has significant differences, a standardization procedure must be applied.
This study used the so-called direct standardization method. This technique allows for a neutralization of the effect of differences in age structure between the population groups being compared. This procedure involves applying the age-specific rates for each group to the distribution of a previously defined standard population. This results in a standardized overall rate and permits the making of more equitable comparisons. In this study, the proportional age distribution of the adult population (both sexes) residing in Spain in 2021-2023 was used as the standard population (see Table A4 of the online appendix).
The total standardized rate for both sexes was obtained as a weighted average of the standardized rates by sex, using the weights of the sex distribution of the adult population of Spain in 2021-2023 (see Table A5).
The gap between the rates for Spaniards and foreigners narrows by 48 % upon standardizing for age and sex (see Table 2). In other words, approximately half of the difference can be explained by the different demographic structure. The immigrant population is concentrated in younger cohorts and includes a higher proportion of males. These are groups which, according to the evidence, report higher crime rates (Ousey and Kubrin, 2009; Sampson, 2008). Finally, the fact that women have lower rates underscores the need to include sex in the analysis of crime.
Table 3 presents age- and sex-standardized rates by geographic origin. Only the most representative countries from each group are listed. The group of Balkan countries includes Albania, Bosnia and Herzegovina, Kosovo, Montenegro, North Macedonia, and Serbia. The so-called “Islamic world” group includes Maghreb, the Middle East (excluding Israel) and Southwest Asia. The “Affluent countries (not EU)” group includes countries from America, Europe, Asia and Oceania (see Table A3 of the online appendix for more details). Of the information included in Table 3, the following key aspects are noteworthy:
- Sex ratio: Due to migration selection biases, the number of men per 100 women among foreigners is higher (105) than among Spaniards (94). However, there is considerable variability between countries. For example, for Mali it is 1082 men for every 100 women, while for Nicaragua it is only 32.
- Gender differences in crime rates: On average, rates among males are six times higher than those found for females.
- Comparisons between Spaniards and foreigners: Even after controlling for age and sex, crime rates among foreigners are almost double those of Spaniards. It is relevant to highlight the heterogeneity in criminal behavior within the foreign population.
- Differences by geographical groupings:
- The population from Asia and the Pacific has crime rates that are almost 50 % lower than those of Spaniards.
- In contrast, those from “Eastern Europe (not EU)” and Latin America have rates that are 2.5 times higher.
- Groups from the Islamic world and from Sub-Saharan Africa had higher rates than the average found for the foreign population as a whole.
- On average, the crime rates from the “Affluent countries (not EU)” and from the European Union (both eastern and western) were higher than those observed in the Spanish population.
- Variability by country: The differences are even greater when analyzing the rates by country of origin. Some countries from Africa (Mali), Latin America (Mexico), and the Islamic world (Pakistan), European Union (Germany and Italy) and Asia and the Pacific (India, China and the Philippines) had rates that were lower than those of the Spaniards. The high crime rates found for the Balkans and Georgia are noteworthy, as they exceed those found in the Spanish population by nine times. Algerians, Ecuadorians, and Dominicans also had high rates, more than three times higher than those of the Spanish population. Colombians, Cubans, Peruvians, Bolivians, French, Moroccans, Nigerians, Belgians, and Romanians had crime rates that were more than double those of Spaniards.
Table A7 of the online appendix details the crime rates by nationality and by crime type.
Evolution of the crime rates in foreigners and Spaniards
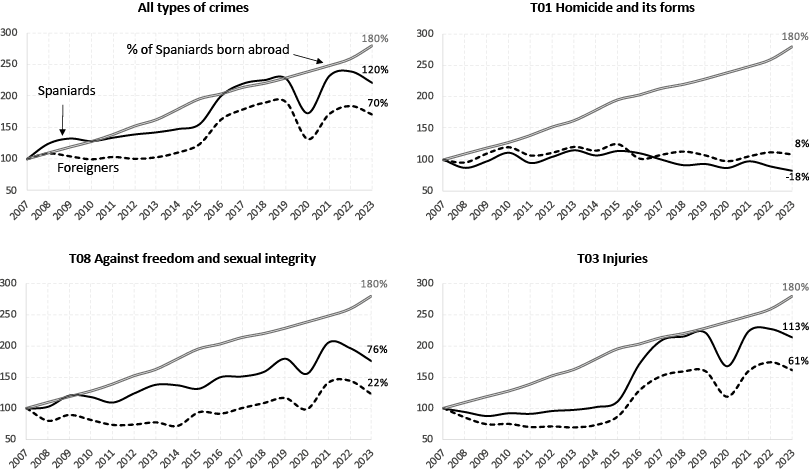
According to Figure 2, between 2007 and 2023, standardized total crime rates increased substantially. However, this increase was greater among the Spanish population (+120 %) than among the foreign-born population (+70 %). In July 2015, a reform of the Criminal Code reclassified misdemeanors as minor offenses, accounting for part of the observed increase in rates. Examining specific crimes of major public concern, we find that homicide rates decreased among Spaniards (-18 %) but increased among foreigners (+8 %). For other offenses, such as sexual and general assault, the increase was more pronounced among the Spanish population.
It may be argued that the increase observed among the native population reflects the naturalization process of a large number of immigrants. Since official conviction statistics record nationality but not country of birth, it is impossible to accurately quantify what exact proportion of the increase in crime rates among Spanish nationals may be attributed to naturalization. However, as shown in Figure 2, while the proportion of Spanish nationals born abroad increased by 180 %, the overall crime rate among the Spanish population increased by a considerably smaller margin (+120 %). Therefore, attributing the increase in crime among Spanish nationals to naturalization processes is an insufficient explanation.
It is more plausible to link the rise in these rates to structural socioeconomic factors. The nearly 50 % increase in the crime rate among the Spanish population between 2007 and 2014 coincided with the social deterioration that began with the 2008 global financial crisis. According to the EPA, the unemployment rate went from 8.2 % in 2007 to 26.1 % in 2013, reflecting a major deterioration in the labor market. At the same time, the Living Conditions Survey (INE) shows that the proportion of people at risk of poverty or social exclusion (AROPE rate) also increased from 23 % in 2007 to 29.2 % in 2014.
In contrast, the increase in the crime rate among the foreign population was more limited. Faced with the difficult economic circumstances beginning around 2008, many foreign residents chose to return to their countries of origin. According to data from the Spanish National Statistics Institute (INE), between 2010 and 2014 the net migration of the foreign population was negative, with a net departure of 434 000 people. This net departure, mainly affecting unemployed individuals or those having less established ties to the community, may have contributed to the fact that crime rates for this population of foreigners did not increase as sharply as the Spanish population.
As of 2020, the deterioration of the socioeconomic conditions resulting from the COVID-19 pandemic increased the crime rate among the Spanish population more than among foreigners. In the crises analyzed, the relative increase was greater for Spaniards than for foreigners.
Is there a relationship between irregular immigration and crime?
In today’s political debate, an idea predominates that immigration should be “ordered, legal and safe”. This widely accepted formulation reflects a legitimate concern about controlling migration flows. It also implicitly conveys the perception that irregular immigration constitutes a threat to public order and citizen security.
With the aggregates available in Table 3, no positive correlation was identified between administrative irregularity and crime levels. In fact, the standardized crime rates of some groups from European Union countries (such as France, Belgium, Romania, and Portugal, all with legal residency) were found to be higher than those of groups having a significant presence of undocumented immigrants. Thus, populations including nationalities from Nicaragua, Russia, Brazil, Honduras, Paraguay, Senegal, Ukraine, Venezuela, and Argentina had lower standardized rates than populations from Eastern Europe as a whole. Furthermore, individuals from Mexico, Mali, Pakistan, China, India, and the Philippines registered rates that were even lower than those of the Spanish population.
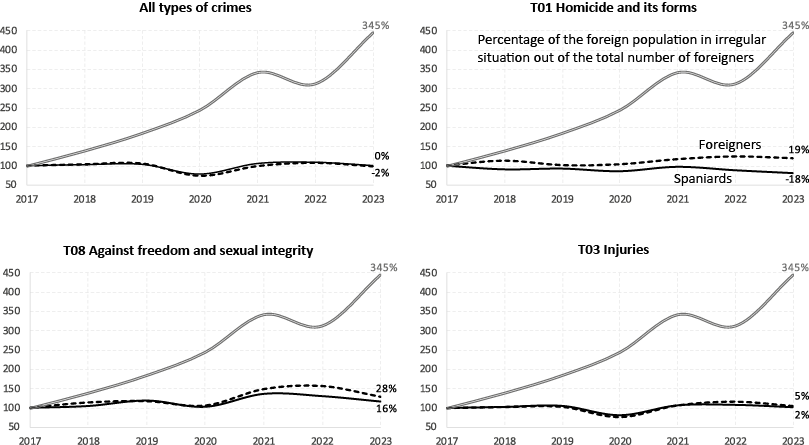
In accordance with the data compiled by Funcas (2024), we have estimated that, between 2017 and 2023, the proportion of undocumented immigrants from the total foreign population increased by 345 %. Meanwhile, the standardized crime rate of all foreigners decreased by 2 %. Increases in homicides (+19 %), sexual offenses (+28 %), and assaults (+5 %) were significantly lower than this increase in the proportion of undocumented immigrants. Therefore, according to available data, the higher proportion of undocumented immigrants within the foreign population has not translated into an increase in the overall crime rate for this group (Figure 3).
According to a 2024 survey conducted by Sigma Dos, respondents in Spain expressed greater sympathy towards immigrants from Latin America (33.5 %) and neighboring European countries (28 %). In contrast, the groups generating the least sympathy were North Africans (2.4 %), Eastern Europeans (5.4 %), Asians (6.5 %), and sub-Saharan Africans (8.9 %) (Torre, 2024).
The data in Table 3 reveal a disconnect existing between levels of social sympathy toward certain foreign groups and their actual crime rates. For example, although on average, the Latin American population has one of the highest crime rates (1662), it is the group that tends to generate the most sympathy. This may be explained by the shared history between Spain and Latin America, and by cultural similarities in areas such as language, traditions, and religious customs. These similarities may reduce social tensions and foster positive attitudes towards this group.
Conversely, the low level of sympathy towards the Asian and sub-Saharan populations is unjustified by their crime rates. In fact, the Asian and Pacific population (426) had a lower crime rate than that of the Spanish population (675). The rate of the sub-Saharan population (1311) was close to the average for the foreign population (1294). The limited social acceptance of these groups appears to be more related to prejudices, stereotypes, and linguistic, cultural, and religious barriers than to their actual crime rates.
Social and structural determinants in the relationship between immigration and crime
Tables 2, 3, and A7 reveal that, even when controlling for age and sex, the foreign-born population commits almost twice as many crimes as the Spanish-born population. However, these data do not allow us to conclude that having the status of immigrant implies a greater propensity for crime. In addition to age and sex, many other variables influence the crime rate of any social group, regardless of whether they are native-born or foreign-born. Some of these factors have been analyzed below:
Foreign ≠ immigrant
It is crucial to distinguish between the terms “foreigner” and “immigrant”. Many foreigners have no plans to establish residency in Spain, which is a prerequisite for being considered an immigrant. Official crime statistics record the nationality of those who have been convicted, but not their residency status. This lack of information makes it impossible to determine who can truly be considered immigrants within the foreign population.
Some foreign nationals, although not immigrants, have been convicted of crimes committed during temporary stays in the country, for either work or tourism. According to data on tourist movements at borders (FRONTUR), Spain received an annual average of 62.3 million international tourists between 2007 and 2023. Criminal offenses were also found to have been committed by these individuals.
The activity of transnational, itinerant criminal groups has been confirmed. These groups consist of non-EU citizens from Eastern Europe who legally enter the Schengen Area and travel briefly between countries, complicating police action (Europol, 2024). They specialize in thefts of homes, businesses, and busy public places, including pickpocketing. They benefit from the limitations of the Spanish judicial system, which often allows for their rapid release, thus encouraging recidivism.
According to the European Drug Report 2023, Spain is one of the main drug entry points for Europe. It is one of the countries with the highest number of illegal drug seizures and has above average domestic consumption. Furthermore, according to Europol (2024), Spain has become a haven for international organized crime, harboring criminal organizations originating from thirty-three countries.
International organized crime responds to the dynamics of illicit markets, geostrategy, and opportunities, and operates independently of migration flows related to residence and settlement. Failing to distinguish between tourists, itinerant criminals, and residents intending to settle, by using criminal statistics for foreigners as an estimate of those for the immigrant population inevitably leads to an overestimation error. This may explain the high rates recorded for the “Balkans and Georgia” group (see Table 3). When calculating these statistics, those convicted from this group are included in the numerator, even though many of them do not reside in Spain. If official statistics included information on the residency status of convicted individuals, it would be possible to calculate the actual crime rates of the immigrant population more accurately.
Managerialism
García España (2024) used the Spanish term gerencialismo or managerialism to describe a penal approach that focuses on administrative efficiency. It concentrates surveillance on supposedly at-risk groups, such as immigrants. This model fosters discriminatory practices such as ethnic profiling in police identifications, which contributes to the overrepresentation of these groups in criminal statistics. In the case of Spain, such dynamics have been extensively documented by Arenas García and García España (2022).
Underreporting of crimes committed by nationals
White-collar crimes, such as financial fraud, corruption, and tax evasion, tend to be committed by upper-class individuals. They are more prevalent amongst the native population as compared to immigrants. However, they tend to receive less attention from the judicial system due to certain structural biases. Offenders usually have economic and legal resources that allow them to influence the course of legal proceedings. Meanwhile, public perception tends to downplay the seriousness of these crimes as compared to violent or street crimes. Esquinas Valverde (2023) showed that, in Spain, there is a large gap between the number of white-collar crimes carried out and the sentences that are actually imposed. This difference may be attributed to deficiencies in the penal system and dynamics of privilege. Therefore, crimes that are committed by native Spaniards are likely to be underrepresented in official statistics. This may lead to a significant bias when comparing crime levels between nationals and immigrants.
Distorted judicial system
According to García España (2024), the judicial system highlights practices that restrict equitable access to justice for certain vulnerable groups, especially the immigrant population. These barriers include the following:
- Lack of adequate legal assistance.
- Acceptance of plea agreements without a full understanding of their implications.
- Lack of qualified interpreters, placing immigrants at a disadvantage.
Sánchez et al. (2024) found that, between 1996 and 2022, 44.4 % of those who were wrongfully convicted in Spain were foreign nationals. This is an overrepresentation when comparing them to their average presence in the prison population (29 %). This data suggests that the foreign population is at greater risk of unjust convictions. These limitations partly explain the disproportionate weight of foreign nationals in criminal statistics.
Legal status of immigrants
Until its reform in May 2025, which reduced the period to two years, the 2011 immigration regulations required three years of ongoing residence in Spain as a prerequisite for regularization based on social integration. In practice, this regulatory framework indirectly contributes to perpetuating the underground economy and maintaining groups of undocumented immigrants for extended periods. This can clearly increase social vulnerability and facilitate the committing of crimes.
Between 2017 and 2023, the Spanish authorities expelled an average of 1400 foreigners annually due to an “irregular stay”, another five hundred and thirty for having a “sentence or substitution of sentence” and another thousand for “other causes” (Jara, 2023). According to our estimates and based on data from Funcas (2024), this is equivalent to a rate of only 3.7 expulsions for irregular stay per thousand individuals with this immigration status. This low volume may be partly explained by the high average cost of each expulsion (approximately €2300) during that period, according to Ondarra (2024). And this does not include the costs of detention, legal assistance, police intervention, and court proceedings. Deporting the large number of irregular immigrants would result in a financial burden that would be difficult to bear.
Recent studies in other contexts have suggested that regularizing the legal status of immigrants may help reduce the crime levels within this group (Gunadi, 2020; Pinotti, 2017; Mastrobuoni and Pinotti, 2015; Baker, 2015). Access to the formal labor market not only increases income, but it also increases the opportunity cost of crime, jeopardizing economic and social stability. Immigration regularization policies not only represent a humanitarian response, but they may also be effective tools for improving security and social cohesion (Martínez-Schuldt and Martínez, 2017).
Elías, Monras and Vázquez-Grenno (2025) demonstrated that the mass regularization of some 600 000 immigrants in Spain in 2005, most of which were low-skilled workers, not only improved their income and working conditions, but it had no adverse effects on employment or wages for the native population. Furthermore, Social Security contributions increased by approximately 4000 euros annually for each regularized immigrant, with no evidence of an additional increase in public spending on healthcare or education.
Despite the criticism that it has generated in certain sectors, regularization should not be viewed as a renunciation of the sovereign right of states to manage their borders. On the contrary, it constitutes a pragmatic tool used to address a structural migration reality that cannot be resolved solely through control or expulsion mechanisms. Far from rewarding illegality, regularization is a protective measure for society as a whole. It contributes to reducing marginalization and informal employment. Expulsions should be applied selectively and in cases posing serious threats to public safety, and not as a general migration management mechanism.
It is crucial to recognize that many undocumented immigrants—especially those with fewer qualifications—perform jobs that the native population is often unwilling to do. Acknowledging this fact means recognizing a strategic necessity. This is especially the case if we are to consider that a country’s most valuable resource is its people, assuming that they can live in freedom and fully develop their innate creativity.
It is not necessary to resort to mass deportations, since many immigrants leave the country voluntarily when the labor market no longer requires their workforce. According to data from the Spanish National Statistics Institute (INE), between 2010 and 2014 (years of severe economic crisis), net migration balances were negative: -198 000 people from Latin America, -140 000 from the European Union, -122 000 from Africa (of which -87 000 were Moroccan and Algerian nationals), and -9000 from Asia.
Although the number of people illegally entering Spain in small boats and rafts, or by scaling the fences of Ceuta and Melilla, has increased in recent decades, in 2023 only 5 % of undocumented immigrants were of African origin (Funcas, 2024). This is because Spain’s southern border has become one of the deadliest in the world. According to the NGO Caminando Fronteras, 10 500 people died attempting to reach Spain by sea in 2024. This figure does not include deaths that took place during the journey through African territory. Far from representing an opportunity, this migration route has become an extreme and deadly option.
A large proportion of African immigrants entering Spain do not remain in the country. Between 2021 and 2023, approximately 43 000 people from Africa entered the country illegally each year, according to figures and reports from the Ministry of the Interior. Another 53 000 entered with long-term visas, according to records from the Office of the Inspectorate of Migration (OPI). However, according to the National Statistics Institute’s (INE) Migration and Change of Residence Statistics, over 80 000 Africans residing in Spain emigrated abroad each year during that same period.
In 2023, 87 % of all undocumented immigrants in Spain came from Latin American countries (Funcas, 2024). These immigrants, while geographically distant, have strong linguistic, historical, and cultural ties. The native Spanish population tends to display a greater sympathy towards this group. Most of these individuals entered legally with tourist visas, primarily through the Madrid-Barajas Airport, overstaying their authorized period of stay.
The history of Spain includes numerous episodes of irregular emigration to America and Europe. Far from a marginal phenomenon, Spanish emigration to Europe in the 1960s was irregular. The percentage fluctuated between 40 % and 68 % depending on the year, according to Babiano Mora and Fernández Asperilla (2003) and Calvo Salgado et al. (2009). As occurs today with many Latin American immigrants residing in Spain, one million Spaniards emigrated to Europe in the 1960s as tourists. They overstayed their visas and later regularized their immigration status. They were subjected to strong prejudice and marked social stigmatization. This often-forgotten historical experience should encourage us to address contemporary immigration matters with more political and institutional sensitivity.
To reduce the incidence of irregular immigration and the underground economy, it is necessary to significantly increase the number of visas issued. According to OPI data, between 2010 and 2024, Spanish consular offices granted an annual average of only 22 000 work visas. These figures are insufficient given the needs of the Spanish labor market and its comparison with other European countries. For example, the Decreti Flussi approved by the government of Giorgia Meloni in Italy for the 2023-2025 period included an annual approval of 150 000 work visas for non-EU citizens residing abroad.
Ultimately, the high number of undocumented immigrants in Spain stems from a discord between the limited number of work visas granted and the actual needs of the labor market. According to the INE’s Quarterly Labor Cost Survey, the number of job vacancies has steadily increased over the last decade, growing from 56 000 in 2014 to 150 000 in 2024. Meanwhile, the unemployment rate has fallen from 24.4 % to 11.3 %. Substantially increasing the number of visas granted would make it easier for employers to meet their labor needs and would prevent immigrants and their families from being exposed to precarious situations, legal vulnerability, and social exclusion.
Poverty and marginalization
Regardless of their origin, nationality, or legal status, people living in poverty face severe limitations in access to employment, education, and housing, which increases the risk of engaging in certain survival crimes, such as theft and robbery (Torres-Téllez, 2023).
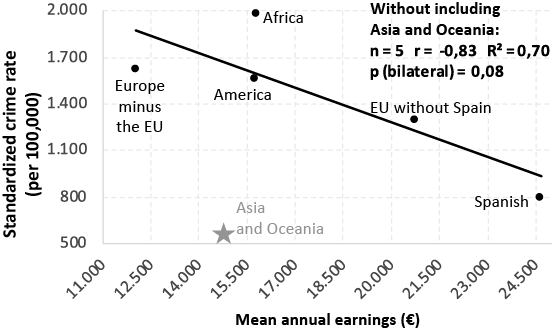
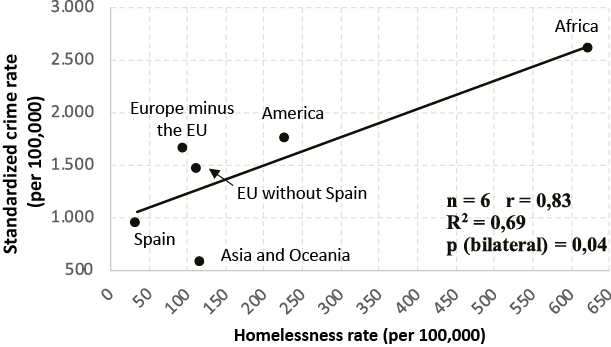
Figure 4 shows the negative (non-causal) ecological association existing between average income and crime rates. The exception is seen in the group from Asia and Oceania, whose crime rates are significantly lower than expected given their income level. This suggests that, in addition to economic factors, cultural and educational variables, such as strict community norms, also play a relevant role.
According to the Annual Report of the Bank of Spain (2024), between 2019 and 2024, approximately 76 % of all new job positions were filled by foreigners. Their arrival filled the demand in sectors facing hiring difficulties such as agriculture, construction, hospitality, and personal care. These sectors are characterized by precarious employment and low wages. Immigrants not only come in search of opportunities, but they also respond to a structural need of the Spanish economy.
Cuadrado and Regil (2025) estimated that between 2022 and 2024, the foreign-born population in Spain contributed 24.1 % of the average annual growth of GDP per capita, despite representing only 17.5 % of the population. This contribution, which exceeds their demographic weight, is explained by the younger age structure and higher activity rates. These are factors which, together, compensate for lower hourly productivity as compared to the native population. According to the INE, between 2007 and 2023, the average employment rate for the population aged 16 and over was 48.2 % for Spanish nationals, as compared to 55.9 % for EU nationals and 53.9 % for those from the rest of the world.
Those opposing current immigration often argue that a large proportion of newcomers lack advanced training. However, before aspiring to attract highly qualified foreign talent, Spain should guarantee the necessary conditions to retain its own. According to the INE, between 2019 and 2021, approximately 26 000 Spaniards with university degrees emigrated abroad annually, along with nearly 50 000 foreign residents having the same educational level.
With a service-based economy, a moderately important industrial sector, a quite low level of RandD, and labor-intensive agriculture, restricting the presence of low-skilled immigrants would not reduce crime in Spain. On the contrary, it would harm economic activity and reinforce vulnerabilities that would foreseeably increase crime, as the 2008 crisis demonstrated.
Access to social services
Access to housing, healthcare, and social assistance reduces stress, improves living conditions, and is associated with lower crime rates. Figure 5 suggests that the higher incidence of crime observed among different groups of foreigners is more closely related to barriers in access to essential services, such as housing, than to immigration status per se.
Cultural integration and associated social conflicts
Gender violence
Certain values and attitudes toward women and LGBTQ+ people in immigrants’ countries of origin may be problematic. Sexist and homophobic behaviors, still existing in certain social and cultural contexts, may conflict with the principles of equality in force in Spain.
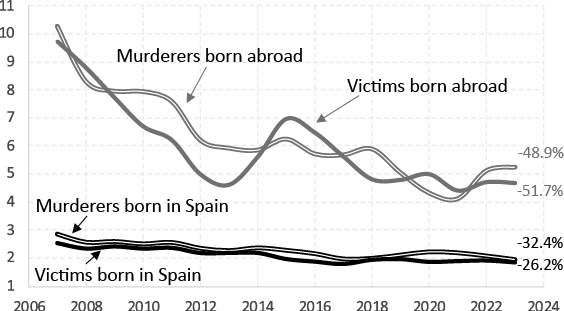
The Ministry of Equality’s statistical portal provides detailed information on femicides, detailed by age and country of birth (Spain or abroad) without specifying the specific country, for both perpetrators and victims. Between 2006 and 2024, 1094 murders of women were reported in the context of a current or former partner, representing an annual average of fifty-eight cases. Figure 6 shows a significant difference in the standardized rates according to the country of birth of the perpetrator and the victim, with a notably higher incidence among the foreign population. Foreign women suffer the greatest violence at the hands of foreign men. The data reveals a downward trend in femicide rates, especially pronounced among people born outside of Spain.
Although some of this gap may be due to cultural differences in relationships, the structural conditions that especially affect immigrant women should not be ignored: language barriers, lack of knowledge of the protection system, economic or emotional dependence, fear of deportation, and lack of support networks (Sanz-Barbero et al., 2016).
Significant differences by nationality are also observed in crimes against sexual freedom and integrity. During the 2007-2023 period, the standardized rate of sexual offenses among foreign males was 24.3 per 100 000 adult males (Latin Americans, 33.6; Islam world, 29.3), as compared to 11.4 for Spaniards (see Table A7 in the appendix).
The Ministry of the Interior’s statistical portal provides data on individuals arrested or investigated for hate crimes related to sexual orientation and gender identity. During the 2014–2023 period, we have estimated the following crude rates per million inhabitants by nationality: Spaniards, 3.1; foreigners, 9.7 (Moroccan and Algerian, 19.5; Latin American, 13.2). It should be noted that the differences in rates between foreigners and Spaniards would almost certainly have been smaller if we had been able to calculate standardized rates.
These data highlight significant challenges to coexistence, requiring the strengthening of cultural integration policies and the promotion of equality, especially in matters of gender and sexual diversity.
Integration of the Muslim population
The social integration process of Muslim communities requires specific attention, given both their growing demographic weight and the challenges of intercultural coexistence. In December 2024, Spain was home to 2.4 million Muslims, primarily those of Moroccan origin. This represented approximately 5 % of the total population (UCIDE, 2025). In light of these figures, speaking of an “Islamist invasion” is a disproportionate interpretation.
Studies by Aleksynska and Algan (2010) and Heath and Schneider (2021) have demonstrated that people from the Maghreb face greater barriers to integration in Western Europe than other immigrant groups. These barriers manifest themselves in access to employment, language proficiency, civic participation, identity formation, and trust in institutions such as the police or the political system. Even with the same level of education, their performance across multiple indicators is consistently worse than that of people from other regions of the world.
On the other hand, authors such as Sanders (2012) dismantled the stigmas associating Muslim immigration with a supposed lack of integration or with the imposition of religious values. They established a parallel with the prejudices affecting Catholics or Jews during other historical times.
Public debate often links Islam with security. This makes it necessary to distinguish between religion, immigration, and extremism. The latter is limited to a minority, although its effects may be amplified in contexts of social exclusion or institutional distrust. According to the Ministry of the Interior’s Map of the Fight Against Jihadist Terrorism, between 2012 and June 2025, 720 arrests linked to this threat were recorded in Spain, equivalent to an annual average of approximately 53. According to Reinares (2024), 36 % of those arrested for jihadist terrorism between 2004 and 2023 were first-generation immigrants, and 52 % were born in Spain to immigrant parents (mainly of Moroccan and Algerian origin). However, first and foremost, jihadist terrorism must be addressed as a serious security problem, and not solely as an immigration issue.
The data on crime from Table 3 show a clear heterogeneity amongst the foreigners coming from primarily Muslim countries. Algeria (3161) and Morocco (1553) clearly exceed the Spanish rate (675), while Mali (613) and Pakistan (436) are below it; Senegal (1108) is below the average for the overall set of foreigners (1294). This diversity makes generalizations less than recommended. It calls for integration policies that are tailored to the context. Crime statistics do not support the thesis of a supposed incompatibility between Islam and Western values.
Integration as a gradual process
Language proficiency and adaptation to social norms promote integration and reduce the likelihood of criminal behavior (Martínez-Schuldt and Martínez, 2017). These processes are gradual and vary in duration depending on personal circumstances and context. According to the 2021 EPA special module, 76 % of immigrants aged 15 to 74 residing in Spain (and 58 % of those not of Latin American origin) report having advanced or native-level proficiency in Spanish. This is a favorable indicator of their potential for future integration.
Over time, most immigrants acquire the language, assimilate the norms, and integrate into the host society. This gradual adaptation may explain the results of longitudinal studies, which reveal that, far from increasing crime, immigrants in fact often reduce it (Kubrin and Ousey, 2023). Therefore, it is important not to base crime analyses solely on cross-sectional data, which may present a distorted picture, as it focuses on newcomers without reflecting the impact of gradual integration.
Rural/urban residence
Crime rates tend to be higher in urban areas as compared to rural ones, due to factors such as population density, anonymity, community disorganization, and the existence of criminal subcultures (Ceccato, 2015).
Hernando Sanz (2016) found that, in Spain, there is a strong correlation between the population size and crime volume. In our statistical models (see Table 1), the percentage of the population residing in urban areas appears as a highly significant factor associated with crime rates. According to data from the INE, in 2021, 52.2 % of all Spanish citizens lived in cities having populations of fifty thousand or more, a figure that increases to 57.6 % for the foreign population. This suggests that crime rates among immigrants may be overrepresented due to their greater concentration in urban areas.
Therefore, proposing a reduction in migration flows, even illegal ones, as a strategy to combat crime would be ineffective, since there are much more decisive underlying factors.
Conclusions
This study underscores the complexity of the relationship between immigration and crime in Spain. It challenges simplistic narratives that link the two directly. Our models reveal that, when taking into account other covariates, a larger foreign population is not associated with higher provincial crime rates.
Comparing crude crime rates between populations with different age and sex structures can be misleading. Standardization improves comparability since after adjusting for age and sex, the gap between the rates of Spaniards and foreigners decreases by at least 48 %. Moreover, disaggregating the data by geographic origin reveals substantial heterogeneity, demonstrating that any homogeneous interpretation of criminal behavior among the immigrant population as a whole is unwarranted.
The study describes consistent associations with age, sex, urbanization, poverty, and access to services. It also observes that some criminal dynamics commonly attributed to immigration are actually due to non-migratory phenomena, such as short-stay tourism or transnational organized crime.
The data reveal significant differences between the native and foreign populations in areas such as violence against women, sexual offenses, and crimes motivated by sexual orientation.
This study finds no evidence of a positive association between irregular immigration status and crime. Research conducted in other countries has even suggested reductions in crime following regularization programs. Far from posing a threat to public safety, regularization policies may help reduce crime by facilitating access to legal employment and promoting social integration. Conversely, restricting immigration could negatively affect economic functioning and, ultimately, may contribute to higher levels of criminal activity.
In short, immigration status alone does not account for variations in crime once demographic and contextual differences are taken into account. Instead, the evidence underscores the importance of structural and institutional factors.
Bibliography
Aleksynska, Mariya and Algan, Yann (2010). Assimilation and integration of immigrants in Europe. Bonn: Institute for the Study of Labor. IZA Discussion Paper, n.º 5185.
Alonso Borrego, César; Garoupa, Nuno and Vázquez, Pablo (2012). “Does Immigration Cause Crime? Evidence from Spain”. American Law and Economics Review, 14(1): 165-191.
Arenas García, Lorena and García España, Elisa (2022). “Police Stop and Search in Spain”. InDret, 3: 233-257.
Babiano Mora, José and Fernández Asperilla, Ana (2003). “En manos de los tratantes de seres humanos”. Historia Contemporánea, 26: 35-56.
Baker, Scott (2015). “Effects of Immigrant Legalization on Crime”. American Economic Review, 105(5): 210-213.
Butcher, Kristin and Piehl, Anne (1998). “Cross-city Evidence on the Relationship Between Immigration and Crime”. Journal of Policy Analysis and Management, 17(3): 457-493.
Calvo Salgado, Luis; Fernández Vicente, María; Kreienbrink, Axel; Sanz Díaz, Carlos and Sanz Lafuente, Gloria (2009). Historia del Instituto Español de Emigración. Madrid: Ministerio de Trabajo e Inmigración.
Ceccato, Vania (2015). Rural crime and community safety. London: Routledge.
Chiswick, Barry (1999). “Are immigrants Favorably Self-selected?”. American Economic Review, 89(2): 181-185.
Cuadrado, Pilar and Regil, Ana (2025). “Una estimación de la contribución de la población extranjera en España al crecimiento del PIB per cápita en el período 2022-2024”. Boletín Económico - Banco de España, 2025/T2, 10.
Elías, Ferran; Monras, Joan and Vázquez-Grenno, Javier (2025). “Understanding the Effects of Granting Work Permits to Undocumented Immigrants”. Journal of Labor Economics, 43(3). doi: 10.1086/730122
Esquinas Valverde, Patricia (2023). Corruptos y delincuentes de cuello blanco en España. Valencia: Tirant lo Blanch.
Europol (2024). Decoding the EU’s most threatening criminal networks. Luxemburgo: European Union.
Funcas (2024). “La población extranjera en situación irregular en España: una estimación”. Notas de Coyuntura Social. Mayo de 2024. Available at: https://www.funcas.es/boletines/notas-de-coyuntura-social-mayo-2024/, access September 7, 2025.
García España, Elisa (2024). “Inmigración y delincuencia: la falacia de una sospecha”. Boletín Criminológico, 11(233).
García España, Elisa; Aguilar-Jurado, Juan A. and Contreras-Román, María (2020). “Settled Immigrants in the City of Malaga”. International e-Journal of Criminal Sciences, 15: 1-21.
Gunadi, Christian (2020). “Does Immigrant Legalization Affect Crime?”. Journal of Economic Behavior & Organization, 178: 327-353.
Heath, Anthony and Schneider, Silke (2021). “Dimensions of Migrant Integration in Western Europe”. Frontiers in Sociology, 6: 510987.
Hernando Sanz, Felipe (2016). “Evolución y distribución espacial del crimen y la delincuencia en España”. Boletín de la Real Sociedad Geográfica, 151: 113-147.
Jara, Yuly (2023). “España ha expulsado a más de 140.000 inmigrantes en los últimos 18 años, la mayoría por estancia irregular”. Newtral, December, 18.
Kubrin, Charis and Ousey, Graham (2023). Immigration and crime. Berlin: Springer.
Maghularia, Rita and Übelmesser, Silke (2019). “Do Immigrants Affect Crime?”. SSRN Electronic Journal.
Martínez-Schuldt, Ricardo and Martínez, Daniel (2017). “Sanctuary Policies and City-level Incidents of Violence, 1990 to 2010”. Justice Quarterly, 34(2): 274-303.
Mastrobuoni, Giovanni and Pinotti, Paolo (2015). “Legal Status and the Criminal Activity of Immigrants”. American Economic Journal: Applied Economics, 7(2): 175-206.
Ondarra, Marcos (2024). “España batió en 2023 su récord de gasto en deportaciones de inmigrantes irregulares”. The Objective, June 17.
Ousey, Graham and Kubrin, Charis (2009). “Exploring the Connection Between Immigration and Crime Rates in U.S. cities, 1980-2000”. Social Problems, 56: 447-473.
Ousey, Graham and Kubrin, Charis (2018). “Immigration and Crime”. Annual Review of Criminology, 1: 63-84.
Pinotti, Paolo (2017). “Clicking on Heaven’s Door: the Effect of Immigrant Legalization on Crime”. American Economic Review, 107(1): 138-168.
Reinares, Fernando (2024). “Caracterización social de los yihadistas en España”. ARI, 30/2024, Real Instituto Elcano.
Ruiz Coll, Miguel (2025). “Un 73%, cinco puntos más que en enero, cree que la cantidad de inmigrantes es «excesiva»”. El Español, July 25.
Ruiz Morales, Manuel (2018). “Factores determinantes de la criminalidad en España”. Via Iuris, 25: 1-41.
Sampson, Robert (2008). “Rethinking Crime and Immigration”. Contexts, 7(1): 28-33.
Sánchez, Nuria; Blanco-Velasco, Guadalupe; Geven, Linda; Masip, Jaume and Manzanero, Antonio (2024). “Wrongful Convictions with Prison Sentences in Spain”. The Wrongful Conviction Law Review, 5(1): 8-26.
Sanders, Doug (2012). The myth of the Muslim tide: Do immigrants threaten the West? New York: Vintage Books.
Sanz-Barbero, Belén; Heras-Mosterio, Julio; Otero-García, Laura and Vives-Cases, Carmen (2016). “Perfil sociodemográfico del feminicidio en España y su relación con las denuncias por violencia de pareja”. Gaceta Sanitaria, 30(4): 272-278.
Torre, Noa de la (2024). “El 46% de los españoles cree que ya hay «demasiados inmigrantes»”. El Mundo, December 6.
Torres-Téllez, Jonathan (2023). “Empirical Evidence on the Relationship Between Material Deprivation and Crime: An Analysis of the Case of Spain”. International E-Journal of Criminal Sciences, 18: 1-25.
Unión de Comunidades Islámicas de España (UCIDE) (2025). Estudio demográfico de la población musulmana en España. Observatorio Andalusí.
1 Acknowledgements: We wish to thank the Confidentiality Committee of the Spanish National Institute of Statistics (INE) for providing access to the “Statistics on Convicted Persons: Adults” database. They are also grateful to Pablo Manzano Serrano and Jaime Orellana Sanjuan for their valuable comments.
Funding: This work received funding from the PHS-2024/PH-HUM-414 project of the Community of Madrid (Spain).