Graph 1. Difference between recalled vote percentages for PSOE and Sumar and their results in the July 2023 election
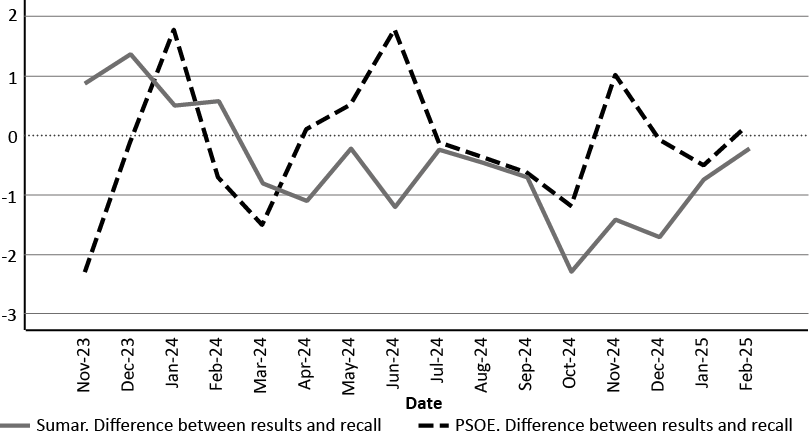
Source: CIS. Prepared by the authors based on series B.6.06.06.073 - Vote recall in the 2023 general election.
doi:10.5477/cis/reis.192.27-46
Vote Recall and Analytical Distortions:
The Spanish Case after the 2023 General Election
Recuerdo de voto y distorsiones analíticas:
el caso español tras las elecciones generales de 2023
Antonio Alaminos and Antonio Alaminos-Fernández
|
Key words Barometers
|
Abstract This study combined units of analysis and methodological perspectives within a triangulated approach to examining vote recall. The barometers conducted by the Spanish Centre for Sociological Research (CIS), alongside the official results of the general election held in Spain on July 23, 2023, were used for measurement purposes. The analysis revealed a significant discrepancy in recalled vote among voters of the Partido Popular (PP) and Vox, which may be associated with vote concealment. In contrast, vote recall percentages among PSOE and Sumar voters were not statistically different from their actual electoral outcomes. It was concluded that vote recall holds analytical value in its own right; however, its use as a parametric weighting variable in surveys tends to distort results, thereby suppressing a valuable indicator for analysing latent processes in electoral dynamics. |
|
Palabras clave Barómetros
|
Resumen Esta investigación analiza mediante triangulación de método el recuerdo de voto medido en los barómetros del Centro de Investigaciones Sociológicas (CIS) y los resultados de las elecciones generales del 23 de julio de 2023 en España. Se constata una diferencia significativa del recuerdo de voto al Partido Popular y Vox, asociada con la ocultación de voto. Una ocultación de voto que podría actuar como estado intermedio del intercambio de transferencias entre PP y Vox. Los porcentajes de recuerdo de voto al PSOE y Sumar no difieren estadísticamente con sus resultados. Se concluye que el recuerdo de voto posee valor analítico propio; su uso como variable de ponderación paramétrica distorsiona los resultados de las encuestas, eliminando un indicador muy útil para el análisis de procesos latentes en dinámicas electorales. |
Citation
Alaminos, Antonio; Alaminos-Fernández, Antonio (2025). “Vote Recall and Analytical Distortions: The Spanish Case after the 2023 General Election”. Revista Española de Investigaciones Sociológicas, 192: 27-46. (doi: 10.5477/cis/reis.192.27-46)
Antonio Alaminos: Universidad de Alicante | alaminos@ua.es
Antonio Alaminos-Fernández: Centro de Investigaciones Sociológicas | antoniof.alaminos@cis.es
Introduction
Weighting is a common practice in public opinion survey research. A weighting procedure is used to make the sample resemble known parametric distributions. For this purpose, the mere existence of external statistics that could serve as weighting references (typically sociodemographic data) is insufficient, the corresponding variables measured in the survey must also demonstrate specific qualities of robustness and structural consistency. Variables such as sex, age or size of municipality refer to relatively objective and stable statuses of respondents. Therefore, there is cause for debate when opinion-based variables are used as the basis for sample weighting, regardless of the existence of known parametric distributions.
The opinion-based variable we are concerned with here is party vote recall, particularly when it is used to make a parametric population adjustment. Applying weighting by past vote as part of a model specification (where its effects are confined to specific, limited outcomes) is very different from applying that weighting to the entire sample. Weighting a sample using subjective variables distorts the data, as it makes structural patterns dependent on the distribution of a conjunctural opinion that changes over time.
The most significant debate concerning weighting based on vote recall is in the field of electoral forecasting. As noted by Irving Crespi (1988), vote recall was often used in the United States until the 1960s and 1970s as a correction factor in electoral forecasting. This was a questionable practice that fell into disuse due to the problems it caused. In the United Kingdom, while weighting based on vote recall was a major source of debate following the predictive error of polls in the 2015 British general election, it has been retained for election forecasting. Research conducted by the British Polling Council and the Market Research Society into the contributing factors to the error concluded that one of its main causes may have been the use of biased vote recall as a correction factor (Sturgis et al., 2016). In Spain, the use of weighting by past vote as a predictive procedure began in the mid-1980s as part of the models based on the spiral of silence developed by Elisabeth Noelle-Neumann. It is a practice that has persisted over time, although its original theoretical purpose of operationalising and controlling for vote concealment has evolved through new methodological interpretations, in which weighting by vote recall takes on parametric functions for population adjustment.
In Spain today, particularly in commercial polling, there is an unexamined consensus that regards the use of vote recall from the most recent election as an axiomatic parametric correction variable for population adjustment, paying little attention to any theoretically grounded analytical interpretation. A growing body of evidence has been recently provided on this matter, particularly supported by contributions from various specialists involved in the Spanish Senate Committee of Inquiry into the management of the Centre for Sociological Research by its Chairman [Comisión de Investigación sobre la gestión del presidente del Centro de Investigaciones Sociológicas].
These experts have repeatedly asserted that there is sampling bias in the polls of the Centre for Sociological Research (CIS), which was evidenced by the alleged differences between the vote recall measured in the survey and the election results.
Michavila (2024) stated:
If you have a survey that you know is systematically biased towards one segment, corrections must be made specifically to correct that deviation (Diario de Sesiones del Senado, No. 181: 4).
Lorente developed this critical observation further by arguing: "The percentage of right-wing voters interviewed was several points lower than it should have been and the left was overrepresented" (2025: 5). Llera argued:
The problem is that if you are dealing with a sample that needs to be checked, that has a recall bias, and you don’t correct it, that bias will be carried over into the estimation (2025: 9).
What is clear is that, when assessing the estimation results—even those based on sample data—there is a consistent bias resulting in the overrepresentation of left-leaning voters. And if the samples exhibit a bias towards the overrepresentation of the left, then it must be corrected through technical procedures. This is unavoidable (2025: 10).
Requena held a similar view:
And then the final stage occurs, […] a process of self-selection bias within the sample from the outset, resulting in the governing party’s voters being overrepresented and the opposition party’s voters being under-represented (2025: 13).
Lamo de Espinosa concluded:
Recall of the Partido Popular (PP) vote is always lower than the results the PP actually obtained […]. If you don’t use that [weighted] system, the result will be less favourable (2024: 12).
Crespo (2025) asked a question (which this study answers): “How does a sample come to systematically overrepresent left-wing voters’ recall?” How is this even possible?" (Diario de Sesiones del Senado, No. 282: 6). And finally, Gonzalo Adán said:
Let's see what happens. I am beginning to have doubts as to why recall of the PSOE vote is higher than one might expect. We know that recall of the PSOE vote is always high, it's a classic, but is it that high throughout the rest of the poll? We are looking into it (Diario de Sesiones del Senado, No. 275: 16).
It is worth noting the lack of distinction made by the experts between the estimation of electoral support (which, in the case of the CIS model, includes weighting based on past vote in one-third of its scenarios) and the sample estimates (where it clearly does not). Arango provided a more substantiated account by observing that the usual mechanism for correcting these biases is vote recall, although he qualified that it is not enough, nor should it be used uncritically. “Vote recall alone is not enough, because social and political trends often lead to distortions in how people remember their past vote” (2024: 5). A statement likely based on his experience as Chairman of the CIS in the early 1990s, when the Noelle-Neumann model's weighting was used as a corrective factor in the prediction model.
Despite the apparent consensus within Spanish polling, there is an ongoing debate among specialists regarding the advisability of weighting—or not weighting—by vote recall, whether for parametric adjustment purposes, or, in a more restricted way, as part of a model (Fernández-Santana, 1994; Alaminos, 1994, 2018; Sanz de la Tajada, 1988, 1994; Urquizu, 2005; Balaguer, 2010; Escobar et al., 2014; Pasadas, 2014; Cabrera-Álvarez and Escobar, 2019; Ferrándiz and Camas, 2019; Alaminos and Alaminos-Fernández, 2023). However, before considering the need for weighting and its intended purpose, it is first necessary to identify the discrepancies between the sample estimates and the electoral results of the CIS barometers, with the aim of assessing claims regarding sample bias.
Theoretical framework
As a method of data collection, public opinion surveys are subject to various biases and potential errors extensively documented over the last several decades in the survey methodology literature, one of which is the under-representation of certain population segments in the sample. Population composition biases are usually adjusted using parametric weighting based on structural variables (such as age, place of residence or sex). These variables are considered robust, even if susceptible to minor deviations (e.g. age rounding by 0 or 5).
However, methodologically, the weighting of the sample is highly questionable when the variables used for the parametric adjustment are opinion-based variables. Parametric adjustment by weighting with subjective variables carries a high risk of introducing further distortion in the sample by allowing the influence of cognitive biases. In studies of voting behaviour, two prominent sources of bias are recall bias (memory) and hypothetical bias (conditionality). Both biases involve complex cognitive processes that affect how people report their past experiences, present attitudes and possible future behaviours. From the 1940s and 1950s onwards, individuals' memory and anticipatory ability began to be considered unreliable (Cantril, 1944). From the latter half of the twentieth century through the early twenty-first century, a solid empirical foundation was established for the systematic understanding of these biases (Cannell and Kahn, 1968; Sudman and Bradburn, 1974, 1982; Bradburn, 1983; Bradburn, Rips and Shevell, 1987; Krosnick, 1991; Alaminos, 1998; Tourangeau, 2000).
Recall bias considers respondents' difficulties in accurately recalling past events, which may lead to omissions, reinterpretations or distortions of lived experience (Cannell and Kahn, 1968; Sudman and Bradburn, 1974; Bradburn, 1983; Bishop, 1990; Alaminos, 1998). Human memory is not a perfect "store" of information, but an active and reconstructive process, subject to the influence of current cognitive schemas, emotions and motivations (Schuman and Presser, 1996). In general, there are two types of problems with the interviewee's memories.
The first is omission bias, whereby the person has difficulty remembering the information requested. Memory depends on factors such as the length of time that has elapsed since the event occurred, how significant and important it was in the person’s life at the time, and how significant and important it remains today (Cannell and Kahn, 1968; Swaddle and Heath, 1987; Singleton et al., 1988; Schacter, 1999; Belli et al., 1999; Belli et al., 2001; Stocké and Stark, 2007; Alwin, 2007; Roberts et al., 2019; Tourangeau, 2000). The more distant in time the event is, the more likely it is to be distorted, either by selective forgetting, rational reconstruction or interference from later events (Schwarz and Sudman, 2012; Dillman, 2020). This bias tends to occur when the cognitive frameworks of the respondent do not match what is being asked (McGuire, 1993; Sullivan et al., 2002; Lachat, 2007). In this sense, omission bias is different from mere forgetfulness, as it could be the consequence of a conscious selection of information that the interviewee considers relevant, which does not necessarily coincide with what is relevant for the research.
The second problem stems from memory distortion. People do not remember the past in an objective way, and tend to distort the order in which events happened in the past in an attempt to make them consistent with each other. Such distortions may also result from unconscious efforts to maintain a positive self-image (DeMaio, 1984; Phillips, 1971). Distorted temporal perception expresses two cognitive biases, averaging and telescoping (Sudman and Bradburn, 1974, 1983; Singleton et al., 1988; Alaminos, 1998). Averaging bias is the tendency to respond to a specific, one-off event according to the behaviour that has been most common in the interviewee. The phenomenon of not precisely answering questions about particular dates, but applying what is usual practice for the interviewee, has very important consequences. For example, when respondents provide the name of the party they have voted for most frequently as their vote recall, averaging bias may result in misleading conclusions by temporally linking events that did not occur simultaneously, thereby distorting the vote transfer matrix.
Telescoping bias occurs when a person incorrectly places a past event in a more recent time period, or believes it occurred within the reference period when it actually happened earlier (Kalton and Schuman, 1982; Schacter, 1999; Schacter and Dodson, 2001). It is part of the "rationalised recall" effect (Alwin, 1992; Bishop, 1987) and occurs when respondents are asked to recall the party they voted for in previous elections. Some people retrospectively adjust their response, aligning it with their current preferences or with what is considered socially desirable (Marcus, 1986; Levine, 1997; Krosnick, 1991; McDonald and Hirt, 1997; Belli et al., 1999; Schacter, 1999; Schacter and Dodson, 2001; Joslyn, 2003).
These biases are analysed in multiple studies aimed at investigating distortions in vote recall. For example, why in post-election surveys the proportion of individuals who claim to have voted often exceeds the recorded turnout (Dinerman, 1949; Calahan, 1968; Clausen, 1968; Hugh and Crossley, 1950; Parry and Crossley, 1950; Miller, 1952; Freeman, 1953; Campbell et al., 1980; Jowell et al., 1993). A discrepancy can be also observed between party vote recall and official election results (Benewick et al., 1969; Himmelweit et al., 1978; Traugott and Katosh, 1979; Katosh and Traugott, 1981; Eubank and Gow, 1983; Granberg and Holmberg, 1986; Gronke, 1992; Traugott et al., 1992; Wright, 1993; Moon, 1995; Atkeson, 1999; Box-Steffensmeier et al., 2000; Craig et al., 2006; Durand et al., 2015).
A second bias of analytical interest, which we will briefly consider, is the hypothetical bias that recognises respondents’ difficulty in envisioning future behaviour or responding to counterfactual scenarios (Warwick and Osherson, 1973; Brislin, Lonner and Thorndike, 1973; Armstrong et al., 1975; Warwick and Lininger, 1975; Bulmer, 1982; Alaminos, 1998). Respondents’ answers are often based on internalised ideals or social norms ("I would like to be a good citizen"), rather than on the actual behaviour they exhibit when the actual decision time comes (Tourangeau, 2000; Wetzelhütter, 2020). Moreover, envisioning future answers to hypothetical questions can be affected by a lack of information or uncertainty about contexts that do not yet exist (Gilbert, 2015; Krosnick and Presser, 2010). These answers are generally approximations based on general attitudes, rather than information about what they will actually do. When responding to hypothetical questions, people tend to provide an ideal answer; however, when confronted with an actual decision, more specific considerations grounded in real-life circumstances usually emerge.
Objectives, hypotheses
and data
The main objective was to evaluate the measurement of vote recall collected in the CIS barometers. The study began with a series of questions, some of which had already been raised in speeches delivered in the Senate of Spain, namely: do statistically significant differences exist between the vote recall variable in CIS surveys and actual election results? Based on vote recall, is there an over-representation of PSOE voters in the surveys? If statistically significant discrepancies exist, are these discrepancies ideologically driven? Are these discrepancies of a statistical (parametric) nature, or can they be explained by alternative patterns? Finally, if a pattern is identified, what explanatory model does this reflect in the Spanish context? Does this pattern offer heuristic potential for studying the inter-party dynamics of the electorate? Is concealment of vote recall an example of significant non-response? The above questions structure the presentation of the analysis, the subsequent discussion and the conclusions drawn from the study.
The design employed t-tests and time series analysis of the CIS barometer surveys conducted since November 2023. This approach triangulated both the (individual and aggregate) units of analysis and the methods used (variance analysis and time series analysis). In this way, t-tests were used to assess the difference between sample estimates and parameter (election results), while time series identified dynamics in the joint distributions of vote recall and vote intention. The examination of cross-correlation patterns between vote time series made it possible to detect dynamic transfer interactions that remain hidden in cross-sectional data (Bryman, 2016; Denzin, 2012; Kittel, 2006; Alaminos and Alaminos-Fernández, 2021a, 2021b).
Barometer data were used because they provided highly comparable designs (sample sizes and questionnaire sequence). The analysis employed the time series produced and distributed by the CIS data bank, available online, based on a nationally representative sample of the Spanish population aged 18 and over, of all genders. The sample specifications for each of the surveys can be consulted on the CIS website. The questions considered were "Can you tell me which party or coalition you voted for?", "In the next election to the Spanish Parliament, which party will you vote for?". The analysis will focus on the four national parties with parliamentary representation: PSOE, Partido Popular (PP), Sumar and Vox.
The August value was interpolated for both variables by imputing the mean value of the values adjacent to the missing value. The data referring to vote recall corresponded to respondents who claimed to have participated in the July 2023 general election, in order to avoid the “double barrelled” effect generated by the composite variable "vote recall + past election participation" (Alaminos, 2025b).
Results
The first analysis provides answers to several of the questions posed, including the differences between the vote recall variable in the CIS surveys and the election results (see Table 2).
The percentages for recall of the PSOE and Sumar vote did not show any statistically significant differences (95 % confidence interval) from their actual results in July 2023. The mean test for recall of the PSOE vote saw a slight deviation of 0.49 with respect to the test value (31.07), for a t-statistic = 1.842 with 15 degrees of freedom. It could be concluded that the mean recall of the PSOE vote was not statistically different from the results achieved. In the case of Sumar, the difference between the mean vote recall and the actual electoral results obtained was -0.48 for a t-statistic = -1.957 with 15 degrees of freedom, indicating that the difference was not significant.
The situation was different for conservative electorates. The mean difference in recalled vote for the PP was -8.20, for a t-statistic of -18.8 with 15 degrees of freedom, indicating a highly significant difference with respect to the test value of 33.05. These results showed that the percentages for the recall of PP vote were significantly lower than the results the PP obtained in July 2023. For Vox’s voters, there was a difference of -3.1 in vote recall with respect to the test value of 12.39, for a t-statistic of -16.652 with 15 degrees of freedom. Recalled vote for Vox was significantly lower than the party’s actual results in July 2023.
The differentiated patterns between right-wing and progressive parties are reflected in their temporal dynamics (see Graphs 1 and 2).
The trend shows a reduction in variance in the most recent months, where the series tended to converge towards the reference line (0) within the margin of error1. There was no statistical evidence of an overestimation of recall of the PSOE vote in the observed data. In the case of Sumar, the differences were also smaller, following a pattern in which, although vote recall initially showed positive values, it recorded negative values after the formation of the government and the departure of Podemos from the coalition.
The longitudinal analysis of the differences between recall of Vox and the PP vote showed patterns that were consistent with the mean comparisons previously conducted. The differential between recall of Vox and the PP vote and their respective electoral results systematically showed negative values, particularly prominent in the case of the PP. This evidence raises the question of whether conservative electorates are under-represented or whether there are alternative explanations. In order to explore the possible responses, a cross-correlation analysis was carried out between recall of the two parties’ vote with the categories that capture vote concealment: the "no answer" and "can’t remember" options.
The PP was the only party for which vote recall showed a statistically significant association with vote concealment (Graph 3). A significant negative correlation was observed between vote concealment and vote recall regarding the PP at lags +1 and 0. This indicates that when vote concealment increased, recall of the PP vote tended to decrease almost simultaneously or with a slight time lag. As more voters hid their electoral preference in the polls, recall of the PP vote adjusted downwards in the following measurement. This reveals a case of significant partial non-response, where non-response contains substantive theoretical meaning.
Adopting a different analytical perspective, vote concealment was also linked to variations in the intention to vote for Vox (see Graph 4), although this followed an inverse pattern to that previously observed between vote concealment and recall of the PP vote. The cross-correlation analysis between Vox voting intention and vote concealment showed a positive and significant relationship at lags -2, -1 and 0. In particular, the correlation was stronger at lag -2 (0.606, standard error = 0.267) and -1 (0.602, standard error = 0.258), suggesting that an increase in vote concealment preceded an increase in the intention to vote for Vox. The correlation at lag 0 (0.582, standard error = 0.250) reinforced the idea that both phenomena were closely related in the same period.
Further evidence of the temporal interrelationship between conservative electorates in Spain can be seen when considering the cross-correlation between recalled PP vote and intention to vote for Vox (see Graph 5).
The cross-correlation analysis between recall of the PP vote and the intention to vote for Vox (see Graph 5) revealed a significant inverse relationship, with the most prominent values at lags 0 and 2, indicating that an increase in recall of the PP vote was associated with a decrease in the intention to vote for Vox in the same period (lag 0, correlation = -0.598, standard error = 0.250) and two periods later (lag 2, correlation = -0.580, standard error = 0.267). When percentages of recall of the PP vote were high, the intention to vote for Vox tended to be lower. This effect persisted with a temporal lag, suggesting a possible electoral dynamic whereby recall of the PP vote may be linked to a reduced future inclination to express an intention to vote for Vox; and conversely, a decline in recall of the PP vote may be associated with a greater intention to vote for Vox in the future.
Recall of the PP vote preceded the intention to vote for Vox, although there is also some indication that those who expressed an intention to vote for Vox may have reconstructed their recall of past vote based on their current party preference. The negative correlation in lags -1 and -2 (-0.437 and -0.330, respectively) suggests that a higher intention to vote for Vox might precede a decrease in recall of the PP vote, reinforcing the idea of an electoral trade-off between the two parties.
There is evidence of a strong dynamic of interaction between the electorates of the PP and Vox, which can be seen again in the cross-correlation between the intention to vote for the PP and the intention to vote for Vox (see Graph 6).
Cross-correlation analysis between intention to vote for Vox and intention to vote for the PP revealed a significant negative relationship at the closest lags, particularly at lag 0 (-0.804, standard error = 0.250) and at lags -1 (-0.593) and -2 (-0.567), indicating that when the intention to vote for the PP increased, the intention to vote for Vox decreased in the same period and in the period immediately preceding it. This exchange pattern illustrates electoral competition for the same voter base between the two parties, since the strong negative correlation at lag 0 means that the variations in the intention to vote for PP and Vox (respectively) moved in opposite directions simultaneously.
Discussion
Claims about an over-representation of PSOE voters in CIS surveys arise, firstly, due first to a misinterpretation of the data, and second to an operational error in using an "analytical artefact"; and thirdly, probably from a cognitive bias in the analysis (Alaminos, 2025b).
The confusion in the interpretation of the data can be seen in Crespo's statements :
Recall of the PSOE vote was 31.2 over census; it was 20.9 over census, that is, it was over-represented by 10.3 points. [...] Sumar: out of 11.6, it was over-represented by 3.5 points. [...] Left-wing vote recall was overrepresented by almost 15 points compared to the right (2024: 6).
The percentage of 31.2 % referred to above is the percentage of recall of votes cast, and not the percentage of votes over the electoral census. A naive error showing the cognitive distortion effects generated by "analytical artefacts".
Secondly, the misperception of an excess of progressive voters was produced by using a compound variable, constructed by design, as a parametric adjustment reference. The variable used for weighting by past vote was the result of combining past election participation and vote recall (Alaminos, 2025b). In doing so, a census recall variable was constructed that was systematically distorted due to overreporting of participation in the reference election. Vote recall based on the census, operationalised in this way as the combination of valid vote recall and recall of participation, is an analytical construct. Analytical artefacts refer to apparent results that stem not from observed social phenomena, but from the technical, operational or logical conditions of the instrument used to measure it (Gigerenzer, 2004). When these types of artefacts are not properly identified as such, they may be interpreted as substantive findings, distorting the description of reality. Thus, Lorente persistently used an analytical artefact as a point of reference:
Here, in the first column and in the second, in blue, we have the results of the July 2023 general election: the number of voters and the percentage they represent out of the total census, not of out of the valid vote or the valid vote for candidacy, but of the total census (2025: 5).
Finally, the focus was placed on an alleged excess of progressive voters in the sample, neglecting to consider the obvious deficit in recall of conservative vote. This conservative deficit has been seen as a collateral effect of the excess of progressive respondents, whereas, in fact, it contains its own patterns. Based on empirical evidence, the correct question to answer is not whether there was an excess of progressive voters, but whether there was an absence of conservative voters.
Lower recall percentages among voters of conservative parties was a frequently cited pattern until the mid-1990s, which found its theoretical explanation in the spiral of silence model (Noelle-Neumann, 1995). Subsequently, there was an interpretative reorientation, possibly as a consequence of a change in the frequency of studies. As the patterns detected in cross-correlation analyses refer to 1 or 2 lags, i.e. one or two months, the quarterly measurement adopted by the CIS in the mid-1990s made it impossible to detect. Recall patterns and their exchange function were rendered invisible.
Lower percentages of recall of the PP vote have been recurringly found in public opinion polls in Spain, as shown by the data from pollsters that publish this variable. Thus, all surveys performed by 40dB, which were conducted online using CAWI, showed lower recall of the PP vote than of the PSOE vote. This phenomenon was also seen in the external validation surveys commissioned by the CIS from opinion pollsters. It can be conjectured that, given the results of applying the models of several polling companies to CIS data, they are very likely to identify lower percentages of recall of the PP vote in their own data than those related to the PSOE.
The erroneous perception of an excess of progressive voters in the CIS data has generated various explanatory attempts, such as a possible self-selection bias among respondents. A self-selection bias that might have resulted from the refusal by people of conservative ideology to be interviewed by the CIS (Requena, 2025):
When the respondent holds an ideological position whereby they perceive the CIS to be an unreliable institution, then they refuse to do the interview and put the phone down [...]; whereas, if the respondent holds an ideological position closer to the party or parties in government, they are more likely to respond to the CIS survey (Diario de Sesiones del Senado, No. 286: 135).
An unnecessary an argument that collapses under the absence of the very phenomenon it attempts to explain.
In addition to the non-existence of the sampling bias they assume, multiple pieces of empirical evidence contradict the statistical significance of the house effect. In the validation surveys commissioned to multiple polling firms (using the same sample design and identical data collection procedures), no significant differences were observed with respect to the CIS data, once the influence of the research centre’s name on fieldwork was accounted for. It must also be considered that, just as there may be a refusal to be interviewed by the CIS, the opposite reaction exists, as has been documented in various media: "They're the CIS and I’m going to give them a piece of my mind about what I think of the government".
Another issue under debate is the use of weighting by vote recall as a parametric sample adjustment procedure. As indicated in random sampling, and more often by quotas, independent status indicator variables such as age, gender, place of residence, education or occupation are used to balance the sample so that it resembles population distributions. However, the existence of a past reference regarding its population distribution (election results) does not entail that the vote recall variable in a survey possesses in itself (in how it is measured) the necessary properties to be used as a reference for parametric adjustment (Alaminos and Alaminos-Fernandez, 2023).
Moreover, the persistence of the pattern in which recall of the PP vote fell below the party’s actual electoral results reveals the mistaken assumption that applying vote recall constitutes a parametric adjustment. If in most of the samples drawn by the use of different designs, sample sizes and modes, the recall of the PP and Vox vote were lower than their respective electoral results, this would confirm the existence of patterns that would require a theoretical explanation instead of statistical weighting. The absence of data and the substantial differences in the designs of the public opinion surveys of the pollsters make it difficult to validate the observed patterns (Alaminos, 2025a).
Another reason limiting the comparison of the patterns observed in "vote recall" in the CIS barometers with other data sources lies in the differences in how the questionnaire was administered. The data available are those published by the company 40dB, which conducts its CAWI-based interviews using online forms. As a general rule, the self-administered mode of questionnaire delivery influences the response options of the variables. In this case, it is not feasible to replicate the pattern analysis on vote recall, as the "can’t remember" and "no answer" options are usually missing. Vote concealment generally lacks measurement categories in self-administered questionnaires.
Conclusions
The analysis has yielded a number of significant conclusions. First, the claim that there was a sample deviation benefiting progressive voters in the CIS polls is wrong. The data analysis shows that there was no pattern whereby the percentage of progressive voters (PSOE and/or Sumar) was overestimated in the CIS data.
The interpretation which holds that there was an over-representation of progressive voters is based on three errors. Firstly, there has been a conceptual error, as there was a confusion between the variables that express the percentage of the vote as a percentage of the census, and the percentage of the vote expressed as a percentage of valid votes cast. Secondly, the distortion introduced by collapsing participation and party recall into a single operational variable past election participation and the recall of the party voted for. This new variable was an analytical artefact. This created a distorted proxy variable, primarily due to inflated recall of participation. Thirdly, there was a cognitive bias that focused on the supposed excess of PSOE voters as an explanation for the chronic deficit of PP and Vox voters. Analysts’ attention was shaped by a confirmation bias prevalent among conservative commentators, which resulted in failure to assess the information available from different points of view, in an exercise of methodological reflexivity (Bourdieu, Chamboredon and Passeron, 1991).
Additionally, the arguments put forward by various experts to explain the alleged sampling bias in the CIS data due to the over-representation of PSOE voters have proven to be nonsensical, as it has been established that there were no statistically significant differences in recall of progressive parties’ vote. The conclusion is obvious, in the sense that underweighting a supposed overestimation of the progressive vote involves artificially reducing its estimation.
However, a lower percentage was found of recall of conservative (PP and Vox) vote. Based on this finding, the central question is to determine whether this under-representation has a parametric statistical basis (recall as a sample adjustment) or a theoretical statistical basis (recall with heuristic utility). In the former, the upward weighting of conservative parties could have some statistical grounding; nevertheless, if the lower recall of conservative vote actually corresponds to its concealment within other categories (such as “no answer” or “can’t remember”), upward weighting artificially inflates its estimation.
The analysis indicates that there is a significant negative cross-correlation between the PP and vote concealment. That is, the part of the conservative electorate that does not appear in vote recall is actually sheltered in concealment. When this evidence is assessed together with the evidence of the non-overestimation of the progressive vote, it leads to an obvious conclusion: the combination of the underweighting of the progressive vote with the overweighting of the conservative vote generates a large distortion in vote estimation, falsely induced by an erroneous analysis of the sample composition.
A new analytical development is worth highlighting at this point, namely that the concealment of the conservative vote observed in the survey takes on a new role in the Spanish case. In the 1980s, vote concealment was due to what was socially desirable in that period. Given that the dictatorship was still a recent memory, the conservative parties were subject to a degree of social sanction on democratic grounds. Today, with the memory of the dictatorship having largely faded, two radicalised parties with highly similar profiles and shared electorates compete within the ideological right; therefore, in vote concealment (measured as "no answer" or "can’t remember" the party they voted for) gains additional heuristic potential.
The concealment of electoral support for the PP may partly reflect that electoral decision making is "in progress". But on this occasion it does not refer to a previous phase in the decision to vote for the PP. The strong ideological contiguity between the PP and Vox generates a pool of people who had "decided which way to vote, but were undecided as to the actual party", largely made up of former PP voters, with a high probability of transferring to Vox. Ultimately, vote concealment may operate as an electoral transition stage, connecting vote transfers between the two parties in both directions. Partial non-response categories may reflect a particularly meaningful state of electoral indeterminacy. It is not a matter of indecisiveness in voting for one party, but an expression of ambivalence between two party options.
The evidence in support of this hypothesis can be found in the cross-correlation between the intention to vote for Vox and vote concealment, vote recall and the intention to vote for the PP. The interplay between PP vote recall, concealment, and voting intentions for both PP and Vox and intention to vote for Vox were statistically significant. It is worth noting that, although the intention to vote for the PP preceded the intention to vote for Vox, indicating a voter transfer dynamic from the PP to Vox over time, the positive relationship in positive lags suggests that a degree this change of preference may be somewhat reversible.
Therefore, a clear conclusion of this analysis is that the recommendation to weight the sample according to census vote recall in order to perform a parametric adjustment is misguided. Such weighting, if considered parametric, affects all survey variables, seriously distorting survey results by relying on an analytical artefact.
Vote recall is an indicator variable with substantial analytical power to reflect the dynamic behaviour of the electorate. This dynamism is nullified and erased when weighting by past vote is applied. Once the sample is weighted by this variable, the distribution of vote recall is transformed to resemble election results. Finally, it should be emphasised that the dynamics subjectively captured by vote recall are intertwined with hypotheses about future voting decisions. This relationship observed in the case of conservative voters between memory (concealment and recall) and the future hypothesis (intention) establishes an avenue of research on the interrelation between cognitive patterns that needs to be explored further; especially given that the analyses reinforce the validity of the hypothesis that there are shared cognitive mechanisms between the two variables of vote recall and voting intention (Krosnick and Schuman, 1988).
Bibliography
Adán, Gonzalo (2024). Comparecencia ante la Comisión de Investigación sobre la gestión del presidente del CIS. Diario de Sesiones del Senado, No. 275, December 19.
Alaminos, Antonio (1994). Predicciones electorales en España. In: Various Authors, Future Days. Jornadas de prospectiva electoral. Alicante: Fundación Cultural CAM.
Alaminos, Antonio (1998). Teoría y práctica de la encuesta. Aplicación en los países en vías de desarrollo. Alicante: Editorial Club Universitario.
Alaminos, Antonio (2018). “La monitorización de la estimación de voto con modelos ponderados y no ponderados: un test empírico”. Sociologiados. Revista de Investigación Social, 3(1): 145-174. doi:10.14198/socdos.2018.3.1.06
Alaminos, Antonio (2024). Introducción a la medición de apoyos electorales mediante el método de escenarios. Modelo bifactorial Inercia-Incertidumbre. Alicante: Obets Ciencia Abierta. Available at: http://hdl.handle.net/10045/147302
Alaminos, Antonio (2025a). Encuestas de opinión pública y medios de comunicación en España. Un estudio sobre saltos de fe, flogisto, quimeras tecnológicas, mercenarios y avestruces. Alicante: Obets-Ciencia Abierta. Available at: http://hdl.handle.net/10045/151044, access January 1, 2025.
Alaminos, Antonio (2025b). “La construcción demoscópica de la realidad electoral en España. Un estudio de caso sobre el recuerdo de voto”. Revista Obets, 20(2): 273-300. doi: 10.14198/obets.29915
Alaminos, Antonio and Alaminos-Fernández, Antonio Francisco (2021a). Ajuste funcional y exploración de patrones en series temporales. Alicante: Obets-Ciencia Abierta. Available at: http://hdl.handle.net/10045/119078
Alaminos, Antonio and Alaminos-Fernández, Antonio Francisco (2021b). Introducción Práctica a la Sociología Electoral. Alicante: Obets-Ciencia Abierta. Available at: http://hdl.handle.net/10045/119077, access January 1, 2025.
Alaminos, Antonio and Alaminos-Fernández, Antonio Francisco (2023). Modelo Bifactorial Inercia-Incertidumbre Alaminos-Tezanos. Aplicación al diagnóstico preelectoral y evaluación del impacto de campaña. Madrid: Centro de Investigaciones Sociológicas. Available at: http://hdl.handle.net/10045/151468, access January 1, 2025.
Alwin, Duane F. (1992). “Information Transmission in the Survey Interview: Number of Response Categories and the Reliability of Attitude Measurement”. Sociological Methodology, 22: 83-118. doi: 10.2307/270993
Alwin, Duane F. (2007). Margins of Error: A Study of Reliability in Survey Measurement. New York: Wiley. doi: 10.1002/9780470146316
Arango Vila-Belda, Joaquín (2024). Comparecencia ante la Comisión de Investigación sobre la gestión del presidente del CIS. Diario de Sesiones del Senado, No. 201, 16 October.
Armstrong, J. Scott; Denniston, William B. and Gordon, Matt M. (1975). “The Use of the Decomposition Principle in Making Judgments”. Organizational Behavior & Human Performance, 14(2): 257–263. doi:10.1016/0030-5073(75)90028-8
Atkeson, Lonna Rae (1999). “ ‘Sure, I Voted for the Winner!’ Overreport of the Primary Vote for the Party Nominee in the National Election Studies”. Political Behavior, 21: 197-215.
Ayuso Sánchez, Luis (2024). Comparecencia ante la Comisión de Investigación sobre la gestión del presidente del CIS. Diario de Sesiones del Senado, No. 262, December 11.
Baka, Aphrodite; Figgou, Lia and Triga, Vasiliki (2012). “‘Neither Agree, nor Disagree’: A Critical Analysis of the Middle Answer Category in Voting Advice Applications”. International Journal of Electronic Governance, 5(3/4): 244-263. doi: 10.1504/IJEG.2012.051306
Balaguer, Jaime (2010). “El recuerdo de voto en España. Un análisis del período 1996-2008”. Revista Internacional de Sociología, 68(3): 637-677. doi: 10.3989/ris.2008.10.17
Belli, Robert F.; Traugott, Michael W.; Young, Margaret and McGonagle, Katherine (1999). “Reducing Vote Overreporting in Surveys: Social Desirability, Memory Failure, and Source Monitoring”. Public Opinion Quarterly, 63(1): 90-108. doi: 10.1086/297704
Belli, Robert F.; Traugott, Michael W. and Beckmann, Matthew N. (2001). “What Leads to Voting Overreports? Contrasts of Overreporters to Validated Voters and Admitted Nonvoters in the Amercican National Election Studies”. Journal of Official Statistics, 17(4): 479-498.
Benewick, Robert J.; Birch, Anthony H.; Blumler, Jay G. and Ewbank, Alison (1969). “The Floating Voter and the Liberal View of Representation”. Political Studies, 17(2): 177-195.
Bishop, George F. (1990). “Issue Involvement and Response Effects in Public Opinion Surveys”. Public Opinion Quarterly, 54(2): 209-218. doi: 10.1086/269198
Box-Steffensmeier, Janet; Jacobson, Gary and Grant, Tobin J. (2000). “Question Wording and the House Vote Choice: Some Experimental Evidence”. Public Opinion Quarterly, 64(3) : 257-270.
Bourdieu, Pierre; Chamboredon, Jean Claude and Passeron, Jean Claude (1991). El oficio de sociólogo: Presupuestos epistemológicos. Madrid: Siglo XXI.
Bradburn, Norman S. (1983). Response Effects. In: P. H. Rossi; J. D. Wright y A. B. Anderson (eds.). Handbook of Survey Research (pp. 289-328). Academic Press.
Bradburn, Normal S.; Rips, Lance J. and Shevell, Steven K. (1987). “Answering Autobiographical Questions: The Impact of Memory and Inference on surveys”. Science, 236(4798): 157-161. doi: 10.1126/science.3563494
Brislin, R. W.; Lonner, W. J. and Thorndike, R. M. (1973). Cross-cultural Research Methods. New York: Wiley.
Bryman, Alan (2016). Social Research Methods. Oxford: Oxford University Press.
Bulmer, Martin (1982). The Uses of Social Research Data. London: Allen and Unwin.
Calahan, Don (1968). “Correlates of Respondent Accuracy in the Denver Validity Survey”. Public Opinion Quarterly, 32: 607-621.
Campbell, Angus; Converse, Philip; Miller, Warren and Stokes, Donald (1980). The American Voter. Chicago: The University of Chicago Press.
Cannell, Charles F. and Kahn, Robert (1968). Interviewing. In: G. Lindzey y E. Aronson (ed.). The Handbook of Social Psychology (pp. 526-571). Reading, Mass.: Addison-Wesley.
Cantril, Hadley (1944). Gauging Public Opinion. Princeton University Press. doi: 10.1515/9781400877546
Clausen, Aage (1968). “Response Validity: Vote Report”. Public Opinion Quarterly, 32: 588-606.
Craig, Stephen; Martínez, Michael; Gainous, Jason and Kane, James (2006). “Winners, Losers, and Election Context: Voter Responses to the 2000 Presidential Election”. Political Research Quarterly, 59: 579-592.
Crespi, Irving (1988). Pre-election Polling: Sources of Accuracy and Error. New York: Russell Sage Foundation.
Crespo Martínez, Ismael (2025). Comparecencia ante la Comisión de Investigación sobre la gestión del presidente del CIS. Diario de Sesiones del Senado. No. 282, January 29.
DeMaio, T. J. (1984). Social Desirability and Survey Measurement. A Review. In: F. Turner Charles and E. Martin (eds.). Surveying Subjective Phenomena (Vol. 2). New York: Russell Sage Foundation.
Denzin, Norman K. (2012). “Triangulation 2.0”. Journal of Mixed Methods Research, 6(2): 80-88. doi: /10.1177/1558689812437186
Dillman, Don A. (2020). Three Decades of Advancing Survey Methodology. In: T. W. Smith (ed.). A Meeting Place and More…: A History of the American Association for Public Opinion Research (pp. 95-117). USA: AAPOR.
Dinerman, Helen (1949). “1948 Votes in the Making – A Preview”. Public Opinion Quarterly, 12: 585- 598.
Durand, Claire; Deslauriers, Mélanie and Valois, Isabelle (2015). “Should Recall of Previous Votes Be Used to Adjust Estimates of Voting Intention?”. Survey Insights: Methods from the Field, Weighting: Practical Issues and ‘How to’ Approach. doi: 10.13094/SMIF-2015-00002. Available at: https://surveyinsights.org/?p=3543
Eubank, Robert and Gow, David (1983). “The Pro-Incumbent Bias in the 1978 and 1980 National Election Studies”. American Journal of Political Science, 27: 122-139.
Ferrándiz, José P. and Camas García, Francisco (2019). La cocina electoral en España: la estimación de voto en tiempos de incertidumbre. Madrid: Catarata.
Freeman, Howard E. (1953). “A Note on the Prediction of Who Votes”. Public Opinion Quarterly, 17: 288- 292.
Gigerenzer, Gerd (2004). “Mindless statistics”. Journal of Socio-Economics, 33(5): 587–606. doi: 10.1016/j.socec.2004.09.033
Gilbert, Emily E. (2015). “A Comparison of Branched versus Unbranched Rating Scales for the Measurement of Attitudes in Surveys”. Public Opinion Quarterly, 79(2): 443-470. doi: 10.1093/poq/nfu090
Granberg, Donald and Holmberg, Soren (1986). “Prior Behavior, Recalled Behavior, and the Prediction of Subsequent Voting Behavior in Sweden and the U.S.”. Human Relations, 39: 135-148.
Gronke, Paul (1992). “Overreporting the Vote in the 1988 Senate Election Study: A Response to Wright”. Legislative Studies Quarterly, 17: 113-129.
Himmelweit, Hilde T.; Biberian, Marianne and Stockdale, Janet (1978). “Memory for past Vote: Implications of a Study of Bias in Recall”. British Journal of Political Science, 8(3): 365-375.
Holbrook, Allyson L.; Krosnick, Jon A; Carson, Richard T. and Cameron Mitchell, Robert (2000). “Violating Conversational Conventions Disrupts Cognitive Processing of Attitude”. Questions. Journal of Experimental Social Psychology, 36(5): 465-494. doi: 10.1006/jesp.1999.1411
Joslyn, Mark (2003). “The Determinants and Consequences of Recall Error about Gulf War Preferences”. American Journal of Political Science, 47: 440-452.
Jowell, Roger; Hedges, Barry; Lynn, Peter; Farrant, Graham and Heath, Anthony (1993). “The 1992 British Election: The Failure of the Polls”. Public Opinion Quarterly, 57(2): 238-263. doi: 10.1086/269369
Katosh, John and Traugott, Michael (1981). “The Consequences of Validated and Self-reported Voting Measures”. Public Opinion Quarterly, 45(4): 519-535.
Kittel, Bernhard (2006). “A Crazy Methodology? On the Limits of Macro-Quantitative Social Science Research”. International Sociology, 21(5): 647-677. doi: 10.1177/0268580906065292
Krosnick, Jon A. (1991). “Response Strategies for Coping with the Cognitive Demands of Attitude Measures in Surveys”. Applied Cognitive Psychology, 5(3): 213-236. doi: 10.1002/acp.2350050305
Krosnick, Jon A. and Alwin, Duane F. (1987). “An Evaluation of a Cognitive Theory of Response-Order Effects in Survey Measurement”. Public Opinion Quarterly, 51(2): 201-219. doi: 10.1086/269029
Krosnick, Jon A. and Presser, Stanley (2010). Question and Questionnaire Design. In: P. V. Marsden and J. D. Wright (eds.). Handbook of Survey Research (pp. 263-314). Leeds: Emerald.
Lachat, Romain (2007). A Heterogeneous Electorate. Political Sophistication, Predisposition Strength, and the Voting Decision Process. Zurich: Nomos.
Lamo de Espinosa, Emilio (2024). Comparecencia ante la Comisión de Investigación sobre la gestión del presidente del CIS. Diario de Sesiones del Senado. No. 180, October 2.
Levine, Linda (1997). “Reconstructing Memory for Emotions”. Journal of Experimental Psychology, 126: 165-177.
Llera Ramo, Francisco J. (2025). Comparecencia ante la Comisión de Investigación sobre la gestión del presidente del CIS. Diario de Sesiones del Senado, No. 328, March 17.
Lorente Ferrer, José Ramón (2025). Comparecencia ante la Comisión de Investigación sobre la gestión del presidente del CIS. Diario de Sesiones del Senado. No. 317, March 10.
Marcus, Gregory (1986). “Stability and Change in Political Attitudes: Observe, Recall, and ‘Explain’”. Political Behavior, 8: 21-44.
McDonald, Hugh and Hirt, Edward (1997). “When Expectancy Meets Desire: Motivational Effects in Reconstructive Memory”. Journal of Personality and Social Psychology, 72: 5-23.
McGuire, Willian J. (1993). The Poly-psy Relationship: Three Phases of a Long Affair. In: I. Shanto and W. J. McGuire (eds.). Explorations in Political Psychology (pp. 9–35). Durham: Duke University Press.
Méndez, Mónica and Balaguer, Jaime (2019). ¿Qué votaste en las últimas elecciones? A vueltas con el recuerdo de voto y las dificultades de su medición. In: F. Camas and J. P. Ferrándiz (eds.). La cocina electoral en España. Estimar votos en tiempos de incertidumbre (pp. 129- 143). Madrid: Los libros de La Catarata.
Michavila, Narciso (2024). Comparecencia ante la Comisión de Investigación sobre la gestión del Presidente del CIS. Diario de Sesiones del Senado. No. 181, October 3, pp. 43–53.
Miller, Mungo (1952). “The Waukegan Study of Voter Turnout Prediction”. Public Opinion Quarterly, 16: 381-398.
Montagní, Ilaria; Cariou, Tanguy; Tzourio, Christophe and Gonzalez-Caballero, Juan (2019). “‘I Don’t Know’, ‘I’m Not Sure’, ‘I Don’t Want to Answer?’: A Latent Class Analysis Explaining the Informative Value of Nonresponse Options in an Online Survey on Youth Health”. International Journal of Social Research Methodology, 22(6): 651-667. doi: 10.1080/13645579.2019.1632026
Moon, Nick (1995). “The Case for Quota Sampling”. Survey Methods Centre Newsletter, 15: 9-12.
Murphy, James; Allen, Geoffrey; Stevens, Thomas H. and Weatherhead, Darryl (2005). “A Meta-Analysis of Hypothetical Bias in Stated Preference Valuation”. Environmental & Resource Economics, 30(3): 313-325. doi: 10.1007/s10640-004-3332-z
Noelle-Neumann, Elisabeth (1995). La espiral del silencio. Opinión pública: nuestra piel social. Barcelona: Paidós.
Parry, Hugh J. and Crossley, Helen (1950). “Validity of Responses to Survey Questions”. Public Opinion Quarterly, 14: 61-80.
Peytchev, Andy; Couper, Mick; McCabe, Sean and Crawford, Scott (2006). “Web Survey Design: Paging versus Scrolling”. Public Opinion Quarterly, 70(4): 596-607. doi: 10.1093/poq/nfl028
Phillips, Derek L. (1971). Knowledge from What? Chicago: Rand McNally.
Requena Santos, Félix (2025). Comparecencia ante la Comisión de Investigación sobre la gestión del presidente del CIS. Diario de Sesiones del Senado. No. 286, February 5.
Roberts, Caroline; Gilbert, Emily; Allum, Nick and Eisner, Léila (2019). “Satisficing in Surveys: A Systematic Review of the Literature”. Public Opinion Quarterly, 83(3): 598-626. doi: 10.1093/poq/nfz035
Schacter, Daniel (1999). “The Seven Sins of Memory: Insights From Psychology and Cognitive Neuroscience”. American Psychologist, 54: 182-203. doi: 10.1037/0003-066X.54.3.182
Schacter, Daniel and Dodson, Chad S. (2001). “Misattribution, False Recognition and the Sins of Memory”. Philosophical Transactions of the Royal Society - Biological Sciences, 356: 1385-1393.
Schuman, Howard and Presser, Stanley (1996). Questions and Answers in Attitude Surveys: Experiments on Question Form, Wording, and Context. London: SAGE.
Schwarz, Norbert and Sudman, Seymour (2012). Context Effects in Social and Psychological Research. Berlin: Springer Science & Business Media.
Singleton, Royce and Straits, Bruce C. (2010). Approaches to Social Research. New York: Oxford University Press.
Stocké, Volker and Stark, Tobias (2007). “Political Involvement and Memory Failure as Interdependent Determinants of Vote Overreporting”. Applied Cognitive Psychology, 21: 239-257.
Sturgis, Patrick; Baker, Nick; Callegaro, Mario; Fisher, Stephen; Green, Jane; Jennings, Will; Kuha, Jouni; Lauderdale, Benjamin and Smith, Patten (2016). Report of the Inquiry into the 2015 British general election opinion polls. London: Market Research Society and British Polling Council.
Sudman, Seymor and Bradburn, Norman S. (1974). Response effects in surveys: a review and synthesis. Chicago: Aldine.
Sudman, Seymor and Bradburn, Norman S. (1982). Asking questions: a practical guide to questionnaire design. San Francisco: Jossey-Bass.
Sullivan, John; Rahn, Wendy and Rudolph, Thomas (2002). The Contours of Political Psychology: Situating Research on Political Information Processing. In: J. Kuklinski (ed.). Thinking about Political Psychology (pp. 23-47). Cambridge: Cambridge University Press.
Swaddle, Kevin and Heath, Anthony (1989). “Official and Reported Turnout in the British General Election of 1987”. British Journal of Political Science, 19: 537-570.
Torres Albero, Cristóbal (2024). Comparecencia ante la Comisión de Investigación sobre la gestión del presidente del CIS. Diario de Sesiones del Senado. No. 204, October 17.
Tourangeau, Roger (2000). The Psychology of Survey Response. Cambridge University Press. doi: 10.1017/CBO9780511819322
Traugott, Michael and Katosh, John (1979). “Response Validity in Surveys of Voting Behavior”. Public Opinion Quarterly, 43: 359-377.
Traugott, Michael; Traugott, Santa and Presser, Stanley (1992). “Revalidation of Self-Reported Vote”. NES Technical Report Series. Ann Arbor: American National Election Studies.
Urquizu, Ignacio (2005). “El voto oculto”. Revista Española de Ciencia Política; 13: 119-156.
Warwick, Donald P. and Osherson, Samuel (eds.) (1973). Comparative Research Methods. Englewood Cliffs, N.J.: Prentice Hall.
Warwick, Donald P. and Lininger, Charles (1975). The Sample Survey: Theory and Practice. New York: McGraw Hill.
Wetzelhütter, Daniela (2020). “Scale-Sensitive Response Behavior!? Consequences of Offering versus Omitting a ‘Don't Know’ Option and/or a Middle Category”. Survey Practice, 13(1). doi: 10.29115/SP-2020-0012
Wright, Gerald (1993). “Errors in Measuring Vote Choice in the National Election Studies, 1952-88”. American Journal of Political Science, 37: 291-316.
1 PSOE's result in July 2023 was 31.7 %. Vote recall for the months of March (31.3 %), April (31.2 % and May (32 %) established the convergence trend.
Table 1. Surveys and sample sizes of vote recall series for the July 2023 general election and voting intention in a future general election
|
Survey |
Date |
Recall Variable (N) |
Intention Variable (N) |
|
3427/0 |
Nov-23 |
6986 |
4090 |
|
3431/0 |
Dec-23 |
3949 |
4613 |
|
3435/0 |
Jan-24 |
3391 |
4015 |
|
3441/0 |
Feb-24 |
3292 |
3926 |
|
3445/0 |
Mar-24 |
3374 |
3931 |
|
3450/0 |
Apr-24 |
3401 |
4032 |
|
3457/0 |
May-24 |
3342 |
4013 |
|
3463/0 |
Jun-24 |
3399 |
4011 |
|
3468/0 |
Jul-24 |
3280 |
4007 |
|
3474/0 |
Sep-24 |
3349 |
4027 |
|
3478/0 |
Oct-24 |
3265 |
4005 |
|
3485/0 |
Nov-24 |
3270 |
4009 |
|
3489/0 |
Dec-24 |
3757 |
4621 |
|
3492/0 |
Jan-25 |
3295 |
4024 |
|
3427/0 |
Feb-25 |
3323 |
4042 |
Source: CIS. Series B.6.06.06.073 - Vote recall in the 2023 general election and B.6.06.05.070 - Voting intention in a hypothetical general election.
Table 2. Statistical significance of observed differences between party vote recall and the election results in July 2023
|
Test for one sample |
|||||||
|
Vote recall |
t |
df |
Significance |
Difference in means |
95 % confidence interval of the difference |
||
|
1-factor p-value |
2-factor p-value |
Lower |
Upper |
||||
|
PSOE |
1.8 |
15 |
0.043 |
0.085 |
0.49 |
-0.7 |
1.0 |
|
Sumar |
-1.9 |
15 |
0.035 |
0.069 |
-0.48 |
-1.0 |
0.042 |
|
PP |
-18.8 |
15 |
<.001 |
<.001 |
-8.2 |
-9.1 |
-7.2 |
|
Vox |
-16.6 |
15 |
<.001 |
<.001 |
-3.1 |
-3.5 |
-2.7 |
Source: CIS. Prepared by the authors based on series B.6.06.06.073 - Vote recall in the 2023 General Election and B.6.06.05.070 - Voting intention in a hypothetical general election.
Graph 1. Difference between recalled vote percentages for PSOE and Sumar and their results in the July 2023 election
Source: CIS. Prepared by the authors based on series B.6.06.06.073 - Vote recall in the 2023 general election.
Graph 2. Difference between the percentage of recall of the PP and Vox vote compared to their respective results in the July 23, 2023 election
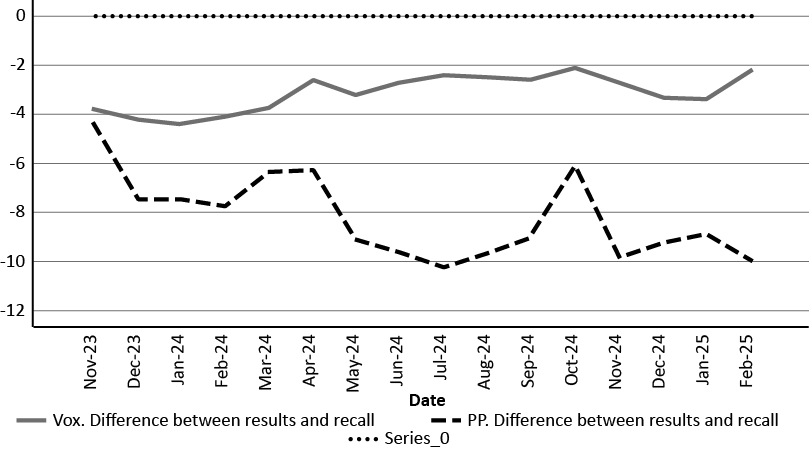
Source: CIS. Prepared by the authors based on series B.6.06.06.073 - Vote recall in the 2023 general election.
Graph 3. Cross-correlation between recalled PP vote and vote concealment in the July 2023 general election
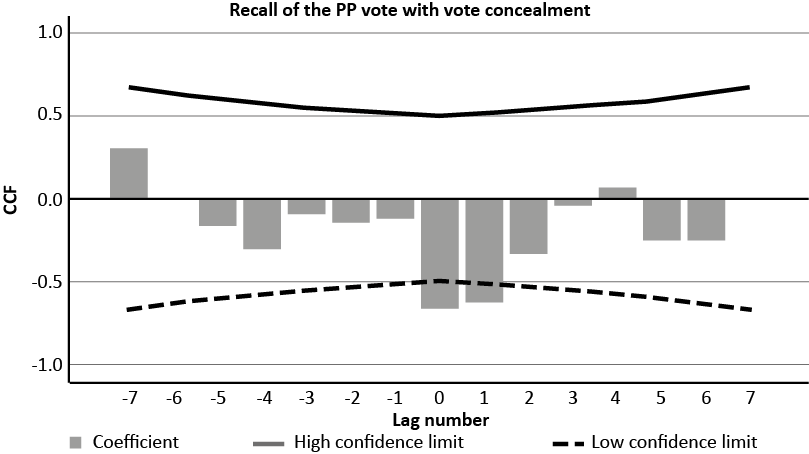
Source: CIS. Prepared by the authors based on series B.6.06.06.073 - Vote recall in the 2023 general election.
Graph 4. Cross-correlation between intention to vote for Vox and vote concealment
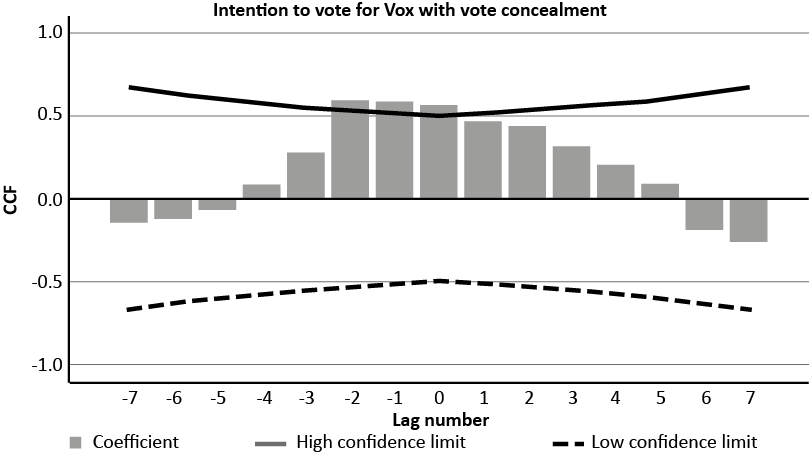
Source: CIS. Prepared by the authors based on series B.6.06.06.073 - Vote recall in the 2023 general election.
Graph 5. Cross-correlation between recall of the PP vote in the July 2023 general election and intention to vote for Vox
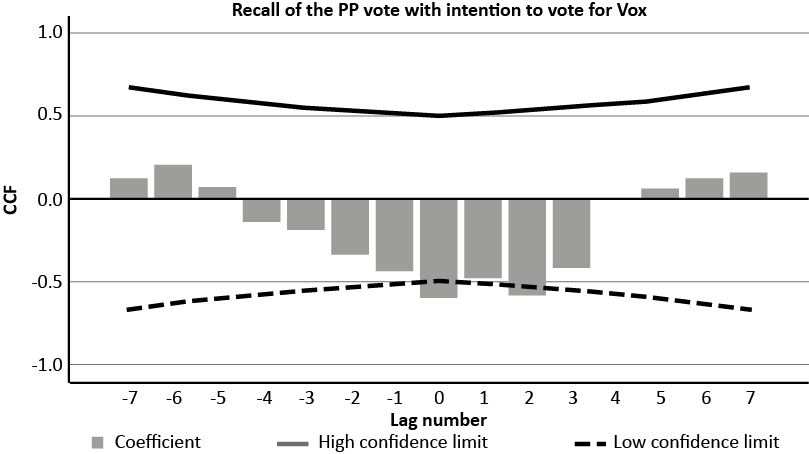
Source: CIS. Prepared by the authors based on series B.6.06.06.073 - Vote recall in the 2023 general election and B.6.06.05.070 - Voting intention in a hypothetical general election.
Graph 6. Cross-correlation between the intention to vote for the PP in general elections and the intention to vote for Vox
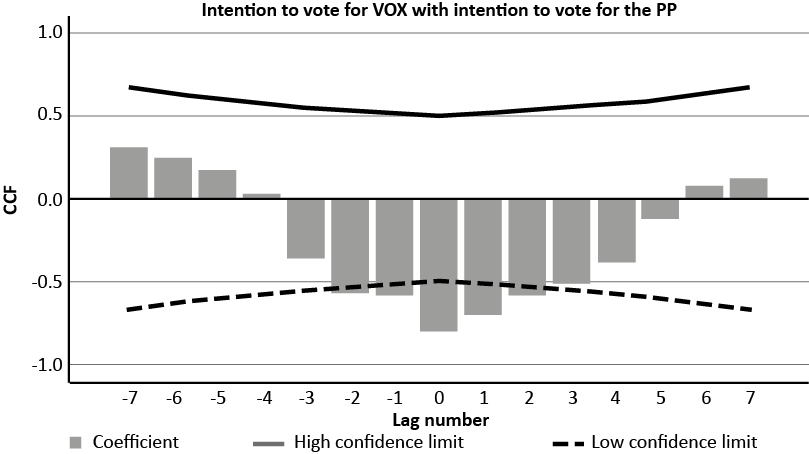
Source: CIS. Prepared by the authors based on series B.6.06.06.073 - Vote recall in the 2023 general election and B.6.06.05.070 - Voting intention in a hypothetical general election.
RECEPTION: February 23, 2025
REVIEW: May 14, 2025
ACCEPTANCE: July 4, 2025