Wealth Inequality from a Generational Perspective: Evidence from the Survey of Household Finances (2002-2020)
La desigualdad de riqueza en perspectiva generacional: evidencia
de la encuesta financiera de las familias (2002-2020)
Iván Soriano Muñoz and Xabier Gainza Barrenkua
|
Key words Wealth
|
Abstract Based on the Bank of Spain’s Survey of Household Finances, and using the Gini and Generalised Entropy indexes, this article analyses the evolution of the distribution of net wealth across age groups over the period 2002-2020. The results show growing polarization, and a decline in the relative position of young households. Inequality is primarily explained by intra-cohort dynamics and young households are now the most heterogeneous group, but differences between groups have increased significantly. The analysis points to changes in property ownership as one of the factors explaining rising inequality, as housing is the main asset in wealth. |
|
Palabras clave Riqueza
|
Resumen A través de la Encuesta Financiera de las Familias elaborada por el Banco de España, y mediante índices de Gini y de Entropía Generalizada, el artículo analiza la evolución de la distribución de la riqueza neta entre grupos de edad durante el periodo 2002-2020. Los resultados muestran una creciente polarización y un deterioro en la posición relativa de los hogares jóvenes. La desigualdad se explica, sobre todo, por las dinámicas dentro de cada cohorte. Los hogares jóvenes son hoy el grupo más heterogéneo, pero las diferencias entre grupos han aumentado notablemente. El análisis apunta a los cambios en la propiedad inmobiliaria como uno de los factores que explican la creciente desigualdad, ya que la vivienda es el principal activo de riqueza. |
Cómo citar
Soriano Muñoz, Iván; Gainza Barrenkua, Xabier (2025). “Wealth Inequality from a Generational Perspective: Evidence from the Survey of Household Finances (2002-2020)”. Revista Española de Investigaciones Sociológicas, 189: 149-166. (doi: 10.5477/cis/reis.189.149-166)
Iván Soriano Muñoz: Universidad del País Vasco UPV/EHU | ivansoriano.21@hotmail.es
Xabier Gainza Barrenkua: Universidad del País Vasco UPV/EHU | xabier.gainza@ehu.eus
Economic inequality has been recognized as of great import in recent decades (Stiglitz, 2013; Deaton, 2013; Atkinson, 2015; Piketty, 2015; Milanovic, 2016). Its importance, in both academic spheres and public debate, has increased, and gained the attention of governments and institutions. There are various reasons for this. As Stiglitz has pointed out (2013), the cost to society of high levels of inequality can be great, as it creates inefficiencies in economic functioning and social fragmentation, which in turn generate conflicts: political polarization, the erosion of democratic institutions, increase in violence, increase in substance abuse and rising suicide rates, among others problems (Acemoglu et al., 2013) (Case and Deaton, 2020).
Academic studies on inequality commonly look at income distribution. The studies by Piketty (2015) and his collaborators (Piketty and Goldhammer, 2020) for example, analyse the evolution of income from employment versus income from capital as the key measure of inequality. However, it is necessary to understand the dynamics of the distribution of wealth. First, because in contrast to income, this is a stock variable of assests accumulated over time. Secondly, wealth is not as well distributed as income (Azpitarte, 2008). Wealth encompasses all types of assets, both financial and real, but it is the latter assets that better explain the dynamics of its distribution. Most household wealth is held in real assets, which account for four-fifths of total net wealth (Lindner, 2015). In considering the latter assets, the home is the most important variable in the distribution of wealth (Pfeffer and Waitkus, 2021). In general, wealth in real assets (such a property) is more equally distributed than wealth from the accumulation of financial assets; in fact, the primary residence together with other properties promotes wealth equality (Azpitarte, 2008). However, this depends on the specific conditions of the real estate market. For example, in contexts in which there is a high percentage of home ownership and very limited social housing, the accumulated wealth gap between homeowners and tenants is quite high (Wind and Dewilde, 2019). It should also be noted that in recent years and resulting from the 2008 real estate crisis we find a consistent increase in housing prices and tighter credit (Lennartz et al., 2015), a trend that has more negatively affected specific population groups.
This study analyses the distribution of wealth in Spain among different age groups for the period from 2002 to 2020. Using data from the Bank of Spain’s Survey of Household Finances [Encuesta Financiera de las Familias (EFF)], and the Gini and Generalised Entropy indexes, the article provides an image of the evolution of wealth distribution among age groups, with particular attention given to young households. The study specifically focuses on determining if there has been a deterioration in the relative position of younger households, and to what extent this is due to dynamics within each age group or to the dynamics between them. To answer this question, the Generalised entropy index breaks down inequality within and between groups, revealing the impact of these dynamics. The focus is on the real estate market, as this is the main determinant of wealth distribution. In the specific case of Spain, the possession of real assets, which account for approximately 80 % of household wealth, is undergoing a process of polarisation as some households are unable to access home ownership (in their majority young people, women and foreigners), while other parts of the population have seen their property assets increase (Boertien and López-Gay, 2023).
This study makes three contributions to the debate on inequality in Spain. First, there has been very limited analysis of the distribution of wealth across different generations. The majority of such studies have focused on the mobility of intergenerational income (Martín and García-Perez, 2023; Palencia-Esteban and Salas-Rojo, 2023) or inequality in opportunities (Rodríguez, 2008; Palomino, Marrero and Rodríguez 2019), but wealth inequality specifically between generations has not been well studied. Secondly, this study takes data from the EFF, the most complete database on wealth. There are very few prior studies that have used this database. Bover (2010, 2011) used data from the 2002 EFF to compare wealth distribution in Spain with Italy, the United States and the United Kingdom, and concluded that Spanish households had the most egalitarian distribution of these four countries. Given the time that has passed and the crises of the past two decades, it is necessary to revisit this issue and even more so from a generational perspective. Third, the Generalised Entropy index permits us to breakdown intra and between group inequality, shedding light on the importance of each of these factors on the evolution of the distribution of wealth.
This article is organised in the following manner: after this introduction, we look at prior studies on wealth inequality from a generational perspective. After, we define the institutional and social contexts that have shaped Spain in recent decades, leading to the hypotheses that guide our study. We then look at the origin of the data we employ and explain our methodology, followed by our main results. Lastly, we present a series of conclusions.
Wealth inequality across generations is the result of a series of interrelated factors. On the one hand, the capital-labour ratio affects the distribution of primary income. The labour market became more flexible over recent decades, leading to segmentation, which has increased wage differences, which, in turn, have had particular impact on young people (De Stefano, 2014). According to Christophers (2018), the increasing precariousness of employment among young people has the following cause: capital, by its very nature, exploits labour; currently, capital exploits labour more intensely than 30 or 40 years ago; the form of labour exploitation is more unjust today than in the past.
Other relevant factors to understand differences in wealth distribution between generations are social and demographic dynamics. The conditions that a specific generational cohort faces are different from those faced by prior generations1 (Freedman, 2023). Some social changes, such as the increase in years of schooling, means that young people today access higher salaries and more stable jobs at later ages, so that their current positions may not be a good indicator of their long-term financial perspectives. The delay in emancipation and new models of family also affect the relative position of young workers. In Spain, later emancipation has altered expectations, discourses and the social acceptance of certain forms of habitation (Fuster, Palomares-Linares and Susino, 2023). Changes in family models, such as the increase in the number of single-parent households, have also had an impact, as the latter have lower levels of wealth (Bugard et al., 2012). In addition, demographic dynamics, such as the increase in life expectancy and migratory movements, have repercussions on intergenerational inequalities by impacting the population pyramid.
To the extent that it constitutes the main asset, the home is another fundamental factor in explaining wealth inequality across generations. According to Case et al. (2005), the nominal value of a home has increased more than inflation and more than the majority of other assets, which means that its relative importance to wealth has increased. Older generations have benefited, while younger generations have not been able to profit from this appreciation in value given that they have not had as favourable conditions to access property ownership. Levels of home ownership have fallen in recent years (Sanderson, 2017). In fact, the financial crisis of 2008 has led to an increase in the proportion of young people who are obliged to rent and unable to acquire their own homes (Gentile, 2014). These changes faced by certain age groups have had important implications for the accumulation of wealth in the long-term (Arundel and Lennartz, 2017).
Something similar has happened with regard to wages, as the cost of housing has increased more than wages (Bengtsson and Lyons, 2015). As a result, home ownership has become increasingly inaccessible, even despite the low interest rates of recent years. In addition, Montgomerie (2013) found that the real borrowing capacity for young people, who must borrow higher amounts in real terms, has fallen. While previous generations faced higher interest rates, but persistent inflation rates that improved their debt position, young people in the last decade have had low interest rates under rigid borrowing conditions, along with deflationary periods, a context that favours lenders.
This situation has resulted in greater polarisation in housing tenure. In some cases, intra-generational inequalities are sharper than between-generational ones. As found by Anderssen (2015) and Jackson (2015), the example of Canada is illustrative. While the home ownership rate for young people has fallen overall, young people with high incomes have seen their rate of home ownership double. Ong ViforJ and Phelps (2023) show this for the case of Australia as well: between 1997 and 2017, the difference in inequality in wealth from property between generations has gone from 161 % to 234 %, but the difference between young people with low incomes and older persons with high incomes has gone from 532 % to 1230 %.
Although these social, demographic, labour market and housing market changes have occurred in all the advanced capitalist societies, their impact on intergenerational inequality has not been the same. As a result, some studies have focused on the welfare regime. Chauvel (2010) indicates that more conservative countries show greater generational inequalities. He suggests this is the impact of their dual labour markets: young people incorporate into the labour market as outsiders, forced to accept low wages that persistently limit their employment opportunities over their life cycles. This perspective is consistent with tendencies recently examined by Freedman (2023), who shows that, in the majority of countries, cohorts after 1980 experienced lower initial wages in comparison to cohorts from 1960-1980.
Focusing on welfare regimes leads us to consider two factors in which countries differ. One is the role of the family in transferring resources to children. These resources can be of very different types, from genes to cultural capital, social networks and economic assets. Given the nature of our study, it is important to look at the effect of economic assets in greater depth. In a seminal study, Kotlikoff and Summers (1981) estimated that inheritance accounted for 80 % of the wealth of the average home. Gale and Scholz (1994) came up with the figure of 60 %, and more recently Salas-Rojo and Rodríguez (2022) found that inheritance is capable of explaining 60 % of total wealth inequality and up to 80 % of inequality in financial wealth. For their part, Fessler and Schürz (2018) concluded that, on average, a European household that had an inheritance increased their wealth distribution by 14 points.
The transfer of assets is particularly important in the acquisition of housing. Ma and Kang (2015) found in their study that households led by young people with parents with higher levels of wealth transition more quickly to home ownership and that a great part of the existing gap in wealth in property can be attributed to differences in parental wealth. Often, the transfer of wealth is in the form of property, and this can be a means for reducing inequalities. A recent study (Lux and Sunega, 2023) found that in “super home-ownership” societies, even parents with low incomes transfer property wealth to their children and this reduces inequality.
Apart from intrafamily transfers, a second factor in the differences between countries is welfare policies. In fact, the role that the family and the state play vary in function of the welfare regime. In societies with strong welfare states, compensation comes from the state, which provides both income transfers and services (low-cost child-care and universal free education, among other things) (Erola and Kilpi-Jakonen, 2017). Welfare policies, however, cannot reduce intergenerational inequalities if they are not aimed at the most poorly situated cohorts. Thus, Conde Ruiz and Conde Gasca (2023) argue that the unequal distribution of income and wealth that can be observed between different generations is the result of what they refer to as “political demography”. In Spain, young people face clear demographic disadvantages, and their lower likelihood of voting in elections, as well as their broad spectrum of concerns converts them into a very heterogeneous electorate. As a consequence, politicians do not allocate sufficient resources to public policies targeted to younger households. In this sense, we find studies that find that welfare systems (social security, pensions, etc.) have a certain bias favouring older persons (Inman, 2014).
In short, we can understand inequalities in intergenerational wealth as the result of a series of social, demographic, labour market and housing dynamics, as well as the role that families and the welfare state play. However, it is interesting to consider whether intergenerational inequalities should be addressed. On the one hand, responses can cause “generational wars”. On the other, although younger households have much worse indicators than the average for the overall population, they are not the only subgroup with these difficulties. Beyond subjective debates over the morality of existing inequalities, numerous studies show that inequalities by class, race and gender within generations do not disappear as the population ages. Through intrafamily transmission, they last. Therefore, to the extent that assets are driven by intergenerational transmissions, existing inequalities will be reproduced (Barrett et al., 2015).
Institutional context
and hypotheses
Institutional characteristics play an important role in intergenerational inequalities. Two institutional factors are of particular importance in Spain, as they are the main drivers of the accumulation of income and wealth: the labour market and the housing market.
To understand Spain’s labour market model, we have to begin with the 1984 labour market reform (Jefatura del Estado, 1984). Under this law, all contract types were liberalised and the requirement that all activity associated with temporary employment contracts had to be of a temporary nature was eliminated. As a result, the proportion of workers between 15 and 24 years of age with temporary contracts went from 40 % to almost 80 % in less than five years. Between 1985 and 1994, approximately 95 % of all new hires were employed with temporary contracts, while only 10 % of these jobs would become indefinite contracts (Güell and Petrongolo, 2003). Sub-contracting also came to play an important role, driving down wages and worsening working conditions. This generated an important duality in the Spanish labour market, a segment of protected workers enjoying stability, and another segment that is exposed to the conditions dictated by the market. This gradual precarisation of employment conditions has accelerated in recent decades. In fact, the under-25s entering the labour market for the first time in 2015 were paid up to 33 % less in nominal terms than young people that entered the labour market in 2008 (Fernández Kranz, 2017).
According to Rodríguez-Modroño (2019), we find three tendencies: an increase in the percentage of NEETs (Not in Education, Employment or Training), a dramatic increase in long-term unemployment and atypical jobs today being the most common way in which young people enter the labour market. Long-term unemployment among young people has several consequences: it does not permit the accumulation of work experience; it has negative effects on income during the life cycle and it impacts personal and family life. In addition, Bell and Blanchflower (2015) show that young people tend to be overqualified for the jobs they carry out. This, along with the lower probability that their initial temporary contracts will become indefinite contracts2, suggests that temporary contracts are not a stepping stone toward permanent employment. It is important to note the different approach to employment policy in northern European countries. While in Spain and other Southern European countries they chose flexibility through temporary contracts, countries in the north opted for the use of part-time contracts. This contract type makes it possible to combine work with study, improving future employability and even fostering investment in the concrete skills demanded by employers, given the expectation of longer-term continuity (Arulamplalam, Booth and Bryan, 2004; Ruiz, Gómez and Narváez, 2004).
Regarding the housing market, the period from 2002 to 2020 can be divided into two almost opposite stages. Until 2008, it was characterised by unprecedented urban development supported by various laws and plans: an Urban Rental Law, a Land Law, a Horizontal Property Law, as well as a Housing Plan 2002-2005. All these efforts had the aim of increasing the housing stock in a context of significant population growth, exacerbated by a period of easy credit and financing. After the real estate crisis of 2008, a stage began in which the weight of housing construction decreased significantly and in which borrowing conditions tightened, limiting access to housing. The lack of housing policies to respond in this period should be emphasised. This, along with the rigid supply and the recovery of demand again pushed property prices upward at the end of the decade of the 2010s, especially in the rental market. Younger households were particularly sensitive to these rising prices. These characteristics of the housing market in Spain place the country within the familist model of Southern Europe, characterised by late emancipation from the family home and the greater likelihood of living with family members. On the opposite side, in countries of northern Europe, where it is more common to receive assistance from the state, emancipation tends to happen earlier (Buchmann and Kriese, 2011; Moreno Mínguez, 2018).
In short, we can characterise certain distinctive aspects of the Spanish context: poor working and employment conditions for young people, difficulty in making the transition from school to work, lack of public resources aimed at the particular conditions young people face and high housing prices that negatively impact emancipation. Based on the arguments in the literature, and taking these conditions into account, we formulate the following hypotheses:
H1: A weakening in the relative position of the youngest households occurred in the first two decades of this century, in terms of both gross income and net wealth.
H2: The relative importance of inequalities between age groups increased in the first two decades of this century.
H3: The rate of property ownership among the youngest households has declined, home ownership being the best vehicle for accruing savings for the average Spanish household.
The Survey of Household Finances (EFF) is a survey carried out since 2002 by the Bank of Spain every three years, which provides detailed information on income, assets, debt and spending of Spanish homes. The wave corresponding to 2020 (EFF2020) is the seventh edition of the survey and offers a representative and up-to-date image of the composition and distribution of household income and wealth based on December of that year.
To analyse the evolution of inequality in Spain, we use the variables gross income and net wealth. Gross income is commonly used in studies on inequality and is included in the main relevant databases (e.g. World Income Inequality Database, Income Study). It consists of the primary total income that a household receives for participation in the productive process plus income from property minus costs on property (interest, dividends, etc.). In contrast with net income, it excludes taxes and transfers, so that it permits us to picture inequality in primary distribution of income (excluding the redistributive effect of taxes and transfers). Net wealth is defined as the total value of (real and financial) assets minus debts. For its computation, the EFF provides the value of means of transport, jewellery, works of art, antiques and businesses owned by any member of the household, as well as investment funds, bonds, pension plans, life insurance and other financial assets (such as loans to third parties). The EFF also contains information on debts unrelated to the purchase of property, including the type, motive and quantity owed.
The unit of analysis is the household, ordered by age range based on the head of the family. The Bank of Spain (BdE) surveys gather information by households, and this is the most common form of analysis in the literature on the distribution of wealth3. According to the BdE, in 2002 and 2020 the households with family heads under 35 years of age represented 14 % and 6.7 % respectively, of all households, those of 35 to 44 years of age represented 22.1 % and 19.5 %, those of 45 to 54 years of age represented 19.7 % and 24.3 %, those of 55 to 64 years of age represented 16.5 % and 20.3 %, those of 65 to 74 years of age represented 17.1 % and 15.7 % and those above 74 years of age, 10.5 % and 13.6 %. In terms of the sample, the BdE uses factors such as elevation and imputation with the aim of achieving maximum representation of the population. In addition, there is an over-representation of households with a high level of wealth This oversampling is essential to guarantee a sufficient number of households that permit us to study the behaviour of the upper segment of wealth distribution, as well as to measure aggregate wealth accurately. This is a crucial aspect in a survey of this type, given that wealth distribution is very asymmetrical and only a small fraction of the population (households with high levels of wealth) invests in certain types of assets.
Regarding methodology, we use different indexes to measure inequality of income and wealth. First, we use the Gini index and Lorenz curves to provide a graphic representation. We also include the standard deviation and coefficient of variation to measure the dispersion of variables, and the Theil index. The latter belongs to the family of measures of general entropy that are based on the quotients between income and average. The Theil index is equal to zero in the case of perfect equality and increases as the distribution becomes more unequal, but in contrast to the Gini coefficient, it does not have a limit of one. Its greatest limitation is that in the analysis within and between groups, it excludes negative values and this characteristic leads us to focus on the following index.
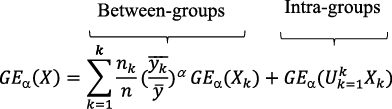
We use the Generalised Entropy Index (GE) to breakdown inequality by age groups and to determine the relative importance of intra and between-group dynamics. The GE has the propery of additive decomposition, that is, it can provide breakdowns by population subgroups and be expressed as the sum of the intra-group component and between-groups component. GE indexes are equal to zero in the case of complete equality, while a higher value on the index indicates greater inequality. Generalised Entropy is computed for all the population.  , can be expressed as:
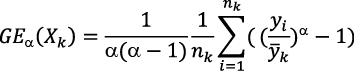
where  is the value of GE computed for households belonging to subgroup
  :
:
and  is the between-
groups component, given that:
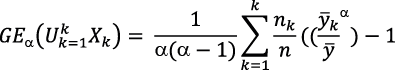
The intra-groups component is calculated as the weighted sum of the value of the indicators in each one of the K subgroups. The between-groups component is calculated as the value of the indicator for a distribution with K elements, each one of which has net wealth the average of the net wealth in the corresponding group and the weight of the participation of the population of the respective group.
Before entering into the analysis of inequality between age groups, we show the evolution of income and wealth distribution in all households. Table 1 presents the different dispersion measures (standard deviation and coefficient of variation) and measures of inequality (Gini index and Theil index). The former reveal how the level of dispersion has increased in regard to the variables of gross income and net wealth, which indicates that both variables had a range of values in 2020 more distant from the average. If we look at the Gini and Theil indexes, there are clear increases, both in gross income and net wealth in the eighteen years covered. In fact, we see a notable asymmetry in regard to the intensity of the increase experienced. While the Gini index for inequality of gross income increased 2 points and the Theil index increased 0.11, inequality in net wealth grew 12 points and 0.83 points respectively. These results are consistent with those found in earlier studies, which show that inequalities increased after the 2008 crisis and intensified in recent years due to the COVID-19 pandemic (Ayala, 2016; Valenzuela-García, 2021).
TablE 1. Measures of dispersion and of income and wealth inequality, 2002-2020
|
Gross Income |
New Wealth |
|||
|
Standard deviation |
2002 |
0.38 |
2002 |
0.57 |
|
2020 |
0.39 |
2020 |
0.69 |
|
|
Coefficient of variation (CV) |
2002 |
1.89 |
2002 |
9.31 |
|
2020 |
3.11 |
2020 |
10.93 |
|
|
Gini index |
2002 |
0.52 |
2002 |
0.74 |
|
2020 |
0.54 |
2020 |
0.86 |
|
|
Theil index |
2002 |
0.56 |
2002 |
1.75 |
|
2020 |
0.77 |
2020 |
2.57 |
|
Source: By authors based on the EFF.
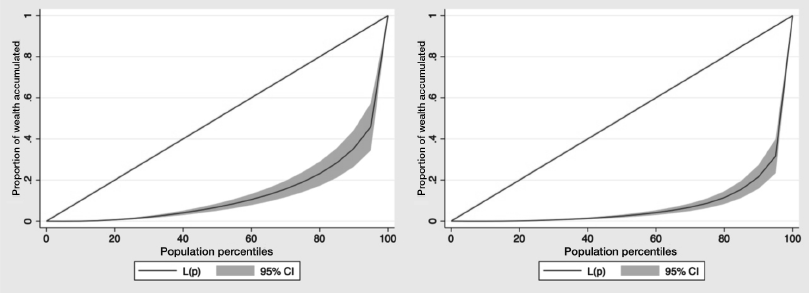
To illustrate these trends, Graphs 1 and 2 provide a representation of the Gini index and Lorenz curve. We can see a shift of the distribution curves for gross income and net wealth toward the right. This means that the richest percentiles were able to increase their incomes and accumulate more wealth than the rest of the population. The richest 20 % of the distribution possessed 60 % of total gross income and almost 85 % of total net wealth in 2020.
Once we look at what happened in terms of population, we must focus on the age group that is the object of this study. Our first hypothesis is that there has been a decline in the relative position of the youngest households. Tables 2 and 3 show in what quintiles of the distribution the different age intervals are located. The quintiles are selected by the BdE in its reports for each wave of the data. When we look at income distribution we find notable changes. The households whose heads are under 35 years of age and below the 20th percentile have grown from 13.74 % to 18.42 % of all households in this age group, almost 6 percentage points. The opposite trend is found for the age intervals from 65 to 74 and above 74, which are the segments that have most improved their position in terms of income: the percentage of households in these age groups in this lowest quintile declining from 29.10 % and 42.40 % to 11.29 % and 16.27 %, respectively. We find these changes not only at the lower end of the distribution. For percentile 90-100, the youngest households lost almost 5 percentage points, while households led by persons over 74 years of age have increased their relative participation by approximately 16 percentage points.
Regarding the distribution of net wealth, we draw similar conclusions. Below the 25th percentile we find very important changes: households of those under 35 years of age have increased their weight from 42.89 % in 2002 to 52.26 % in 2020, and households led by someone between 35 and 44 years of age, have increased their weight from 22.52 % to 32.39 %. This relative worsening for younger households is also found in the percentiles for the highest levels of wealth. Regarding the total for households under 35 years of age in 2002, 8.77 % were situated between percentiles 75 and 90, and 10.19 % between percentiles 90 and 100. These proportions declined to 5.64 % and 4.14 % in 2020. The households in the 35 to 44 years of age range have also seen their participation in the 75-90 and 90 to 100 percentiles decline, going from 15.60 % to 10.08 % and from 15.35 % to 6.23 % respectively. The data also show that those who have done the best in these terms over these almost two decades are those of the highest ages. Households led by someone between 65 and 74 and over 74 years of age have improved their relative position among the richest tenth of the population. In 2002 these age groups accounted for 26.20 % and 23.37 % of the population in this decile, and in 2020 they represented 44.68 % and 49.18 % respectively.
The data, therefore, supports the first of our hypotheses. The question that emerges from these results is if this is a broad phenomenon that effects all young households or, on the contrary if the results are heterogeneous. In addition, we should ask if the differences are explained primarily by intra-group or between-group dynamics. In this sense, hypothesis 2 proposes that the relative importance of inequalities between age groups has increased. To find out if this is accurate we use the GE index, which breaks down the intra and between groups distribution without generating overlaps and shows us the level of dispersion for each group: the higher the level of GE, the greater asymmetry we find in its distribution. From this point on, the analysis will be focused on net wealth, essentially, because of its greater level of concentration.
Table 4 shows the GE and reveals, first, an increase in inequality in total wealth (GE2002=1.36; GE2020=1.51), consistent with the results we find in Table 1. In four of the six age intervals we find an increase in the GE coefficient (<35, 35 -44, 45-54, 65-74), which reflects greater dispersion in those groups. Concretely, the youngest age group and the age group from 45 to 54 are the ones which had the greatest increases, 25.32 % and 25.39 %, respectively. In fact, the interval below 35 years of age is the most unequal: its GE reached 1.87 in 2020, a result of the greater heterogeneity in wealth within the youngest households. In contrast, the oldest group (above 74 years of age) saw its dispersion decrease, as its score on the GE went from 1.28 in 2002 to 1.22 in 2020. These results suggest that households among those under 35 years of age are the most unequal, and along with the 45 to 54 age group, they are the ones where intra-group inequality has increased the most.
The GE index permits us to breakdown intra and between-group inequality, therefore, we can look at the relative contribution of each one of these inequalities. As can be seen in Table 4, the inequality of net wealth in 2002 can explain approximately 9 % of the differences between age groups, a percentage that increases to 15 % in 2020. The 91 % remaining in 2002 and the 85 % in 2020 can be explained by the differences in net wealth within the respective age groups.
There are two fundamental conclusions from these results. First, economic inequalities are essentially explained by differences within each age group. In this sense, our results show that the youngest households are, today, the age group with the most unequal distribution of wealth, with a GE index of 1.87. Addressing the causes of this goes beyond the aim of this article, but this result points to the importance of differences among households within each age cohort. In the case of young people, this could be due to the role that inheritance plays in reproducing inequalities; as Salas-Rojo and Rodríguez (2022) point out, approximately 70 % of total family wealth comes from inheritance.
Secondly, the differences between age groups have increased, explaining 9 % of inequality in net wealth in 2002 and 15 % in 2020. This confirms the second hypothesis: the importance of differences between age groups has increased significantly. The fact that older households have greater net wealth is consistent with so-called life cycle theory (Modigliani and Blumberg, 1954), which argues that in a first stage no income is received, in maturity income from work is received, while negative savings occur during aging. However, there is no apparent cause that explains why differences between groups have almost doubled. In addition, our results show that this has most strongly affected the youngest households, which is the age group with the most unequal distribution of wealth.
As discussed earlier, property is the most important asset in the distribution of wealth (Pfeffer and Waitkus, 2021). In other studies (Kaas, Kocharkov and Preugschat, 2019), it has been found that where home ownership is higher, inequality in wealth is lower, a result shared by other authors (Mathä, Porpiglia and Ziegelmeyer, 2017). Spain is characterized by a high home ownership ratio, which perhaps helps explain the lower levels of wealth inequality in comparison to other European countries. However, it is necessary to examine the dynamics of the real estate market to see if changes in home ownership are occurring. In this sense, hypothesis 3 formulates that the decline in the rate of home ownership in younger households is a determining factor in inequality between generations.
To examine this more deeply, Table 5 presents the home ownership ratio by age. In 2002, 84.48 % of households owned their own homes; this figure fell to 80.34 % in 2020. Therefore, at the aggregate level there has been a decline in the ratio of home ownership. The data show that this decline has occurred within all age groups, except for those over 74 years of age. The age cohort where we find the sharpest fall is among those under 35 years of age, their rate of home ownership having fallen by more than 28 percentage points in only 18 years, followed by the age group from 35 to 44 years of age, who experienced a decline in home ownership of 11 percentage points. These data support the third hypothesis and are consistent with recent research, which has found an increase in inequality between homeowners and non-homeowners in a context in which the ownership of second homes doubled during the period from 2002 to 2017 (Boertien and López-Gay, 2023).
We are in a period of significant growth in economic inequality that is leading to growing polarisation, not only between individuals, but also between generations. Despite the importance of this issue, there have been few studies that have addressed economic inequality between generations in Spain. This study attempts to illuminate this issue, studying the dynamics of the concentration of income and wealth among age groups over the first two decades of this century.
Our results suggest that the relative position of younger households is worse than it was two decades ago. Both in terms of gross income and net wealth, households led by persons below 35 years of age are not only the age group with the highest percentage of households in the lowest positions, but they are also the age group that saw its position in 2020 worsen the most. This contrasts with older households, which are the ones that have seen their relative position most improve. In addition, young households have become the most asymmetrical age group in terms of differences within the group. Although this dynamic is mostly explained by intra-group polarisation, it is also true that the relative importance of differences in net wealth between the different age groups has practically doubled, reflecting growing inter-generational inequality. The role of the housing market has been particularly important in this evolution. Rates of home ownership among the youngest households have declined drastically, leading to increased rates of renting and living with family members.
It is useful to frame these results within a series of economic, social and institutional dynamics. The increase in years spent in school and in labour market flexibility has led to young Spanish people reaching higher salaries and more stable employment later and delayed their emancipation. As with other European societies, there have also been changes in lifestyle that make the situation of younger households different from previous generations. In addition, the family is a fundamental institution for young people in Spain in two ways. On the one hand, it is a support in confronting labour market and housing market conditions. On the other, it is a source for the transfer of resources between generations. The international literature shows that inheritance accounts for a significant percentage of household wealth and is important in the acquisition of housing, which, in general, is a means for reducing intergenerational inequalities. Although we are not aware of studies have looked at this issue in Spain, it is reasonable to consider, as in the other familist countries of Southern Europe, the transfer of resources between generations as an explanatory factor for household wealth. Without downplaying the importance of these factors, in our opinion, the evolution of the housing market plays a special role in the Spanish context. During the 20 years we have looked at, housing costs have risen more than in neighbouring countries, with the exception of an interruption in this trend after the 2008 crisis. At the same time, credit conditions have tightened. This, along with greater precariousness in the labour market, has led housing ownership rates among young people to fall significantly. This has had a notable effect on levels of wealth among this population, as the home is the main means of savings in Spain.
Our analysis, therefore, reveals a growing polarisation and concentration of wealth that has been particularly harmful to young people. However, limitation have not allowed us to address certain issues that merit exploration. The categorisation of the sample by age intervals leaves us with a category of young people that is excessively broad, which means that there is great diversity in this group. It would be useful, therefore, to complete this analysis with more detailed study on the particular situation of this group. In addition, it would be interesting to evaluate the weight of mortgage debt on the different age groups. However, we understand that the fall in the ratio of home ownership is the main indicator for understanding inequalities, as the home, with or without debt, is the main vehicle for accumulating wealth. Lastly, the fact that the data are not longitudinal is an obstacle to analysing the frequency of certain phenomena. For example, we cannot see if the increase in inequality between 2002 and 2008 was due to the persistent effects of the 2008 crisis, or if the decline in equality was a gradual process.
Despite these limitations, the image that this study provides is clear: intergenerational inequalities have increased as the relative positions of the youngest households worsened over the first two decades of the century, both in terms of gross income and net wealth. In addition, this generation, based on the 2020 data, is currently the most unequal among all the age groups examined, and more so than we find for 2002. Until now, young people have been a forgotten part of the political agenda and budgetary considerations have focused on other population cohorts with a greater capacity for political influence. This tendency must change before young people in Spain feel more alienated, decide to emigrate and stop feeling concern for the future of their country.
Acemoglu, Daron; Naidu, Suresh; Restrepo, Pascual and Robinson, James A. (2013). “Democracy, Redistribution and Inequality”. National Bureau of Economic Research, Inc. Available at: https://EconPapers.repec.org/RePEc:nbr:nberwo:19746
Anderssen, Erin (2015). “Growing Generational Divisions are a Worrying Millennial Shift”. The Globe and Mail, 23 April. Available at:https://www.theglobeandmail.com/life/parenting/growing-generational-divisions-are-a-worrying-millennial-shift/article24083323/
Appleyard, Lindsey and Rowlingson, Karen (2010). “Home Ownership and the Distribution of Personal Wealth”. Joseph Rowntree Foundation.
Arulampalam, Wiji; Booth, Alison L. and Bryan, Mark L. (2004). “Training in Europe”. Journal of the European Economic Association, 2: 346-360. doi: 10.1162/154247604323068041
Arundel, Rowan and Lennartz, Christian (2017). “Returning to the Parental Home: Boomerang Moves of Younger Adults and the Welfare Regime Context”. Journal of European Social Policy, 27(3): 276-294.
Atkinson, Anthony B. (2015). Inequality; What Can Be Done? Harvard University Press.
Ayala, Luis (2016). La desigualdad en España: Fuentes, Tendencias y Comparaciones Internacionales. FEDEA.
Azpitarte, Francisco (2008). “The Household Wealth Distribution in Spain: The Role of Housing and Financial Wealth”. Hacienda Publica Española, 194.
Barrett, Garry; Cigdem, Melek; Whelan, Stephen and Wood, Gavin (2015). “The Relationship between Intergenerational Transfers, Housing and Economic Outcomes”. AHURI Final Report, 2015(163): 1-64.
Bell, David N. F. and Blanchflower, David G. (2015). “Youth Unemployment in Greece: Measuring the Challenge”. IZA Journal of European Labor Studies, 4. doi: 1. 10.1186/2193-9012-4-1
Bengtsson, Helena and Lyons, Kate (2015). “Revealed: The Widening Gulf between Salaries and House Prices”. The Guardian, 2 September. Available at: https://www.theguardian.com/uk-news/2015/sep/02/housing-market-gulf-salaries-house-prices
Boertien, Diederik and López-Gay, Antonio (2023). “The Polarization of Real Estate Ownership and Increasing Wealth Inequality in Spain”. European Sociological Review. 39(4): 615-629. doi:10.31235/osf.io/b4k8t
Bover, Olympia (2010). “Wealth Inequality and Household Structure: US vs. Spain”. Review of Income and Wealth. 56: 259-290. doi: 10.1111/j.1475-4991.2010.00376.x
Bover, Olympia (2011). “The Spanish Survey of Household Finances (EFF): Description and Methods of the 2008 Wave”. SSRN. doi: 10.2139/ssrn.1888182
Brandolini, Andrea; Cannari, Luigi; D’Alessio, Giovanni and Faiella, Ivan (2006). “Household Wealth Distribution in Italy in the 1990s”. Banca d’Italia: 225-275.doi: 10.4337/9781847203175.00015
Buchmann, Marlis C. and Kriesi, Irene (2011). “Transition to Adulthood in Europe”. Annual Review of Sociology, 37: 481-503. doi: 3710.1146/annurev-soc-081309-150212
Case, Anne and Deaton, Angus (2020). Deaths of Despair and the Future of Capitalism. Princeton University Press. doi: 10.2307/j.ctvpr7rb2
Case, Karl E.; Quigley, John M. and Shiller, Robert J. (2005). “Comparing Wealth Effects: the Stock Market versus the Housing Market”. Topics in Macroeconomics, 5(1): 20121001.
Chauvel, Louis (2010). “Comparing Welfare Regime Changes: Living Standards and the Unequal Life Chances of Different Birth Cohorts”. In: J. Tremmel, (ed.). A Young Generation Under Pressure? (pp. 23-36). Berlin: Springer. doi: 10.1007/978-3-642-03483-1_2
Christophers, Brett (2018). “Intergenerational Inequality? Labour, Capital, and Housing through the Ages”. Antipode, 50(1): 101-121.
Conde Ruiz, Juan I. and Conde Gasca, Carlota (2023). La juventud atracada: Cómo el electorado envejecido cercena el futuro de los jóvenes. Ediciones Península.
De Stefano, Valerio (2014). “A Tale of Oversimplification and Deregulation: the Mainstream Approach to Labour Market Segmentation and Recent Responses to the Crisis in European Countries”. Industrial Law Journal, 43(3): 253-285.
Deaton, Angus (2013). The Great Escape: Health, Wealth, and the Origins of Inequality. Princeton University Press.
Erola, Jani and Kilpi-Jakonen, Elina (2017). Social Inequality Across the Generations: The Role of Compensation and Multiplication in Resource Accumulation. Northampton, Massachusetts: Edward Elgar Publishing.
Fernández Kranz, Daniel (2017). “Los salarios en la recuperación Española”. Cuadernos de Información económica, 260: 1-11.
Fessler, Pirmin and Schürz, Martin (2018). “Private Wealth Across European Countries: The Role of Income, Inheritance and the Welfare State”. Journal of Human Development and Capabilities, 19: 1-29. doi: 10.1080/19452829.2018.1507422
Freedman, Michael (2023). “Earnings, Cohort Effects, and Inter-Generational Inequality: Evidence From the Luxembourg Income Study”. Review of Income and Wealth, 70(2): 278-290. doi: 10.1111/roiw.12641
Fuster, Nayla; Palomares-Linares, Isabel and Susino, Joaquín (2023). “Changes in Young People’s Discourses about Leaving Home in Spain after the Economic Crisis”. Advances in Life Course Research, 55.
Gale, William. G. and Scholz, John K. (1994). “Intergenerational Transfers and the Accumulation of wealth”. Journal of Economic Perspectives, 8(4): 145-160.
Gentile, Alessandro (2014). “La emancipación juvenil en tiempos de crisis: un diagnóstico para impulsar la inserción laboral y la transición residencial”. Revista Metamorfosis: Revista del Centro Reina Sofía sobre Adolescencia y Juventud, 0: 119-124.
Güell, Maia and Petrongolo, Barbara (2003). “How Binding Are Legal Limits? Transitions from Temporary to Permanent Work in Spain”. Labour Economics, 14: 153-183. doi: 10.1016/j.labeco.2005.09.001
Inman, Phillip (2014). “Baby Boomer Generation Sees a New Twist in an Old Argument”. The Guardian, 9 March. Available at: https://www.theguardian.com/uk-news/2014/mar/09/baby-boomers-survey-affluence-inequality
Jackson, Aandrew (2015). “Inequality and Inter Generational unfairness”. Institut Broadbent, 16 May. Available at: http://www.broadbentinstitute.ca/9344/inequality_and_inter_generational_unfairness
Ley 32/1984, de 2 de agosto, sobre modificación de determinados artículos de la Ley 8/1980, de 10 de marzo, Estatuto de los Trabajadores (1984). Boletín Oficial del Estado, 4 de agosto de 1984, núm. 186. Available at: https://www.boe.es/eli/es/l/1984/08/02/32
Kaas, Leo; Kocharkov, Georgi and Preugschat, Edgar (2019). “Wealth Inequality and Homeownership in Europe”. Annals of Economics and Statistics, 136: 27-54. doi:10.15609/annaeconstat2009.136.0027
Kotlikoff, Laurence J. and Summers, Lawrence H. (1981). “The Role of Intergenerational Transfers in Aggregate Capital Accumulation”. Journal of Political Economy, 89(4): 706-732.
Lennartz, Chistian; Arundel, Rowan and Ronald, Richard (2015). “Younger Adults and Homeownership in Europe Through the Global Financial Crisis”. Population, Space and Place, 22(8): 823-835.
Lindner, Peter (2015). “Factor Decomposition of the Wealth Distribution in the Euro Area”. Empirica, 42(2): 291-322. doi: 10.1007/s10663-015-9290-6
Lux, Martin and Sunega, Petr (2023). “Housing Wealth Inequality, Intergenerational Transfers and Young Households in the Super-homeownership System”. International Journal of Housing Policy: 1-23.
Ma, Kang-Rae and Kang, Eun-Taek (2015). “Intergenerational Effects of Parental Wealth on Children’s Housing Wealth”. Environment and Planning A: Economy and Space, 47(8): 1756-1775.
Martín, Natalia S. and García-Pérez, Carmelo (2023). “The Intergenerational Mobility of Income: A Study Applied to the Spanish Case (2005–2011)”. Journal of Family and Economic Issues, 44(1): 65-83. doi: 10.1007/s10834-021-09809-w
Mathä, Thomas Y.; Porpiglia, Alessandro and Ziegelmeyer, Michael (2017). “Household Wealth in the Euro Area: The Importance of Intergenerational Transfers, Homeownership and House Price Dynamics”. Journal of Housing Economics, 35: 1-12. doi: 10.1016/j.jhe.2016.12.001
Modigliani, Franco and Blumberg, Richard (1954). “Utility Analysis and the Comsuption Function: An Interpretation of Cross-Section Data”. Post-Keynesian Economics, 1: 338-436.
Montgomerie, Johnna (2013). “America’s Debt Safety-net”. Public Administration, 91(4): 871-888.
Moreno Mínguez, Almudena (2018). “The Youth Emancipation in Spain: a Socio-demographic Analysis”. International Journal of Adolescence and Youth, 23(4): 496-510. doi: 10.1080/02673843.2018.1438299
Morissette, Rene; Zhang, Xuelin and Drolet, Marie (2002). “The Evolution of Wealth Inequality in Canada”. SSRN Electronic Journal, 1984-1999. doi:10.2139/ssrn.302880
Ong ViforJ, Rachel and Phelps, Chistopher (2023). “The Growing Intergenerational Housing Wealth Divide: Drivers And Interactions In Australia”. Housing, Theory and Society, 40(2): 238-257. doi: 10.1080/14036096.2022.2161622
Palencia-Esteban, Amaia and Salas-Rojo, Pedro (2023). “Intergenerational Mobility and Life Satisfaction in Spain”. Mobility and Inequality Trends, 109-137. doi: 10.1108/S1049-258520230000030004
Palomino, Juan C.; Marrero, Gustavo A. and Rodríguez, Juan G. (2019). “Channels of Inequality of Opportunity; The Role of Education and Occupation in Europe”. Social Indicators Research, 143(3): 1045-1074.
Pfeffer, Fabian T. and Waitkus, Nora (2021). “The Wealth Inequality of Nations”. American Sociological Review, 86(4): 567-602. doi: 10.1177/00031224211027800
Piketty, Thomas (2015). El capital en el siglo XXI. Madrid: Fondo de Cultura Económica de España. doi: https://doi.org/10.17533/udea.le.n83a10
Piketty, Thomas (2020). Capital and Ideology. Harvard University Press.
Rodríguez, Juan G. (2008). “Partial Equality-of-opportunity Orderings”. Social Choice and Welfare, 31(3): 435-456.
Rodríguez-Modroño, Paula (2019). “Youth Unemployment, NEETs and Structural Inequality in Spain”. International Journal of Manpower, 40(3): 433-448. doi: 10.1108/IJM-03-2018-0098
Ruiz, Antonio; Gómez, Maria and Narváez, Mario (2004). “Efectos de la temporalidad sobre la formación recibida durante el empleo”. Cuadernos de Economía: Spanish Journal of Economics and Finance, 27(74): 51-73.
Salas-Rojo, Pedro and Rodríguez, Juan G. (2022). “Inheritances and Wealth Inequality: a Machine Learning Approach”. Journal of Economic Inequality, 20(1): 27-51. doi: 10.1007/s10888-022-09528-8
Sanderson, Paul (2017). The Impacts of Family Support on Access to Homeownership for Young People in the UK. Social Mobility Comission.
Stiglitz, Joseph (2013). The Price of Inequality. New Perspectives Quarterly.
Valenzuela-Garcia, Hugo (2021). “Teletrabajo y amplificación de la desigualdad en la sociedad post-pandemia española: Teleworking and the Amplification of Inequality in Spain’s Post-pandemic Society”. Revista Andaluza de Antropología, 1(19): 14-36. doi: 10.12795/RAA.2021.19.02
Wind, Barend and Dewilde, Caroline (2019). “In which European Countries is Homeownership more Financially Advantageous? Explaining the Size of the Tenure Wealth Gap in 10 Countries with Different Housing and Welfare Regimes”. International Journal of Housing Policy, 19(4): 536-565. doi: 10.1080/19491247.2019.1608113
1 Analysing what constitutes a generation from a sociological perspective is beyond the scope of this study, see Kertzer (1983) and Roberts and France (2021) for a discussion.
2 7 % of the contracts of the 25 to 39 years of age segment become indefinite contracts, in contrast to an average of 17 % for the EU overall (Rodríguez-Modroño, 2019).
3 We implicitly assume that households have perfect returns to scale in the use of their wealth, as has been done in previous articles (Brandolini et al., 2006).