The Class Pay Gap in Prominent Occupations
in Peru
La brecha salarial de clase en ocupaciones destacadas del Perú
Mauricio Rentería and Saúl Elguera
|
Key words Class Pay Gap
|
Abstract This article seeks to contribute to the study of pay gaps in Latin America, focusing on differences based on social class. Using household surveys, salary differences between individuals working in the most prominent occupations in Peru are analyzed. It is found that social origin determines significant differences in remuneration in the highest income sectors. It is also seen that only 44 % of the pay disparity originating from social background can be explained by observable traits of individuals from the dominant class. Education, specifically, the type of higher education institution attended, emerges as the most relevant factor in understanding the class pay gap. |
|
Palabras clave Brecha salarial de clase
|
Resumen Este artículo busca contribuir al estudio sobre brechas salariales en la región latinoamericana, enfocándose en diferencias basadas en la clase social. A partir del análisis de encuestas de hogares, este estudio indaga las diferencias salariales de las personas que se desempeñan en las ocupaciones más destacadas en el Perú. Se muestra que el origen social determina diferencias significativas en las remuneraciones de los sectores de más altos ingresos. Asimismo, el artículo demuestra que solo un 44 % de la brecha salarial de origen social puede ser explicada por características observables de las personas de la clase dominante. La educación y, en particular, el tipo de institución donde se cursó la educación superior surge como el atributo más importante para comprender la diferencia salarial de clase. |
Citation
Rentería, Mauricio; Elguera, Saúl (2025). «The Class Pay Gap in Prominent Occupations in Peru». Revista Española de Investigaciones Sociológicas, 189: 109-130. (doi: 10.5477/cis/reis.189.109-130)
Mauricio Rentería: The University of Manchester | mauricio.renteriagonzales@manchester.ac.uk
Saúl Elguera: Instituto de Estudios Peruanos | selguera@iep.org.pe
Pay gaps between groups have received considerable attention from researchers studying inequality. Some of the appeal of this study stems from the fact that, while social mobility studies allow us to understand the structural barriers to accessing prominent positions, salary appears to be the best indicator of progression in different fields (Friedman and Laurison, 2019). In other words, although gaps may have closed between distinct segments in terms of access to the highest paying jobs, structural factors of inequality continue to exist in the work environment.
When examining academic production at a global level and, specifically, in the Latin American region, it is apparent that most of the literature on pay gaps focuses first on differences based on gender and, then, those based on ethnicity (Polachek and Xiang, 2021). While recent studies have shown a persistence of large class gaps in Latin America and Peru (Álvarez, 2019; Benavides, 2004; Piovani and Salvia, 2018; Rentería and Zárate, 2022), few works have taken an in-depth look at this inequality dimension (Núñez and Gutiérrez, 2004; Toro, 2021).
This article seeks to contribute to the study of pay gaps in Latin America by focusing on differences based on social origin. Using the “class pay gap” proposal designed by Friedman and Laurison (2019; Laurison and Friedman, 2016) and the class scheme of Rentería and Zárate (2022), salary differences of individuals working in the most prominent occupations in Peru are analyzed. These individuals are referred to as the “dominant class”. It is found that social origin is related to significant differences in remuneration in the highest income sectors. The article also demonstrates that only 44 % of the pay gap based on social origin may be explained by observable characteristics of the individuals from the dominant class. Education, specifically the type of higher institution attended, appears to be the attribute having the most importance in terms of understanding the class pay gap.
Research on pay gaps in Latin America and Spain tends to focus on gender inequality. Latin America is not only the most unequal region in the world, but it consistently reveals a high pay gap between women and men (Psacharopoulos and Tzannatos, 1992). In large part, these differences may be due to the under-representation of women in the labor market and especially in the highest paying occupations (Ortiz-Ospina, Hasell and Roser, 2018). Although gender inequalities in education in Latin America and the Caribbean have reduced considerably over recent years, the income gap persists.
According to Ñopo (2012), women earn lower wages than men for the same jobs, even when they are the same age and have the same years of education. Perticará and Tejada (2021) suggested that of all of the potential factors causing the gender-based pay gap in the region, discrimination is the only one that consistently affects women. On the other hand, the literature examining the Spanish case has revealed a similar panorama, comparable with the majority of studies on gender pay gaps and demonstrating their persistence over recent decades (Anghel, Conde-Ruiz and Artíñano, 2019).
In addition to gender inequality, race and ethnicity have received much attention from scholars interested in measuring pay gaps between groups. The literature on ethnic-racial pay gaps in Latin America presents a scenario in which discrimination and structural inequality significantly determine the advantages and disadvantages of groups at the extremes, especially in those categories that are overrepresented at the lower and upper ends of the social structure: the indigenous and Afro-descendant populations, on the one hand, and those identified as white, on the other hand (Hall and Patrinos, 2012; Scarpetta, 2020). In Peru, the indigenous and Afro-descendant populations have the lowest income levels, while the population identified as white tends to have the highest level (Ñopo, 2004; Ñopo, Saavedra and Torero 2004: 17-18).
Another factor that has been found in distinct studies to be consistently significant in predicting pay gaps is education and its relationship with the individual’s social origin (Arias, Yamada and Tejerina, 2004; Gregg et al., 2017; Toro, 2021). In line with the classic sociological studies on “social reproduction” measured through education (Bourdieu and Passeron, 2009; Willis, 1977), this literature demonstrates that the advantages associated with class of origin (or social origin) affect educational opportunities and therefore, result in pay differences between individuals. Beyond determining different probabilities of educational attainment and access to higher education, these studies suggest that differences in class origin may influence the educational trajectory itself. This contradicts ideas about the supposed equalizing effect of education. For example, Marteleto and Andrade (2014) revealed that the household cultural resources (their “cultural capital”) predicts adolescent performance gaps in the sciences, reading and mathematics in Brazil1.
Studies have also shown that, beyond the differences in the level of education achieved, the type of education, both at basic and higher levels, may lead to pay gaps between individuals (Clark and Bono, 2016; Estrada and Gignoux, 2017; Sullivan et al., 2018). These studies indicate that graduates of elite educational institutions have significantly more opportunities to access the most prestigious and highest-paying occupations.
Although education level and type of educational institution explain a large part of the pay gap between individuals from different social backgrounds, these tend to persist over time. This has been confirmed in recent studies focusing on class pay gaps. Analyzing employment surveys in the UK, Friedman and Laurison (2017, 2019) demonstrated that social origin is a determinant factor in the wage earned by individuals in the most prestigious occupations: those from working-class households earn significantly lower annual incomes than their more privileged peers. However, as Fang and Tilcsik (2022) revealed, in the US, a large part of the class pay gap is due to occupational sorting between more and less privileged individuals in certain industries and jobs. Studies conducted by Friedman and Laurison revealed that, even for the same occupations, and considering a series of sociodemographic factors, the gaps in social origin remain.
Although few studies have been carried out on the pay gap in Latin America and Spain, those examining Chile and Mexico suggest processes similar to those of the global north: class of origin has an independent effect on wage, when controlling for different sociodemographic variables (Núñez and Gutiérrez, 2004; Toro, 2021). For the case of Spain, the literature suggests different results. While the studies of Carabaña and Fuente (2015) and Fachelli, Torrents and Navarro-Cendejas (2014) determined that social origin does not influence the pay of university graduates, Bernardi and Ares (2017) found that this is substantial. As far as we know, in the case of Peru, no studies have focused on the measurement of pay gaps based on class or social origin. This article seeks to help fill this gap in the literature regarding this region.
As we have seen, the literature provides us with a detailed view of the various factors that contribute to wage differences between groups. A common point in these studies is that, in general, these disparities are replicated in different strata of society and in different labor sectors. Following this line, this study investigates how certain forms of inequality are reflected in wage discrepancies through an intersectional approach.
However, as Rubery and Hebson (2018) noted, taking an intersectional approach may result in a bias toward prioritizing certain inequalities over others. Although this article reports some relevant results on gender, ethnic, racial and territorial gaps, we will focus specifically on the class pay gap in the context of Peru. The main objective of this study is to determine the magnitude of the class pay gap in Peru. Then, we attempt to examine the extent to which education level contributes to explaining this gap. To tackle this question, the following hypotheses are created:
H1: Individuals in Peru’s dominant class coming from a non-privileged social background earn less than those coming from a privileged social background, when controlling for sociodemographic and other standard factors.
H2: Educational factors, especially the type of university attended, may significantly explain the class pay gap of individuals in Peru’s dominant class.
The data used for the study result from the combination of 7 years of information (2015 - 2021) from the modules of Education, Employment and Income, Governance, Democracy and Transparency; and the Summary of the National Household Survey (ENAHO)2 of Peru. The combination of data was necessary to ensure an adequate sample size. The analysis unit of the research is the heads of household, since only they are questioned about the educational achievement of their parents3. This information is of interest to this study, since it is the only question providing a means of determining the individual’s social origin. This use of parental education level as a proxy for social background has been justified by much of the literature on intergenerational mobility (Black and Deveraux, 2010; Bukodi and Goldthorpe, 2013; Neidhöfer, Serrano and Gasparini, 2018).
Specifically, the assignment of the type of social origin of the heads of household is carried out using a two-step procedure. First, the educational level of the father and mother of the head of household is compared and the information of the one having the highest educational level is selected. For example, if the father completed secondary education and the mother completed higher university education, the mother’s information is selected. Then, the head of the household is classified as being one of non-privileged social origin if the educational level resulting from the previous step falls between the scales of no educational level and complete secondary education. In the remaining cases, the parent is considered to be of privileged social origin. This allocation mechanism allows for a maximized number of cases to be analyzed4.
On the other hand, it is necessary to determine the current class position of the heads of households. Therefore, the classification of social classes of Rentería and Zárate (2022) is used. Taking a Bourdieusian approach, the authors define four social classes for the case of Peru: dominant class, middle class, working class and field worker class. Given the study objectives, the dominant class is the social category of interest. In this social class scheme, the dominant class is associated with individuals holding prominent occupations in distinct fields, such as company directors, doctors, attorneys or university professors. Belonging to the dominant class is the equivalent of being situated in socially prominent positions which, as Rentería and Zárate (2022) suggested, offer significantly greater economic and cultural capital endowments than the rest of the population.
Using this approach, it is possible to select the heads of household of the dominant class and examine the pay gap existing in this group, based on social origin (privileged or not privileged). Since the aim is to examine differences in work income, the analysis is restricted to those who are active in the labor market and fall within the age range of 25 to 65. The study’s sample framework consisted of 5612 heads of households from the dominant class. The sociodemographic characteristics of these leaders revealed that the majority of them were aged between 45 and 54, married or with a partner, and many had completed higher education, graduating from a standard university. Furthermore, the majority of the interviewed participants were male, mestizo, spoke Spanish, worked in the formal economy and lived in urban areas outside of the Lima department. The highest education level attained by either of the parents of the heads of household was mainly completed secondary education.
To verify the first working hypothesis, initially, the pay gap based on social origin was estimated without considering any control. It was calculated as the difference in the average monthly work-based income between the heads of households of the dominant class coming from a privileged origin and those who from a non-privileged origin.
Subsequently, using 4 multiple linear regressions whose dependent variable was the logarithmic version of monthly work income (see Table 1), the variation of the magnitude of this gap is calculated, considering potential sources of wage inequality in a sequential manner. This procedure is performed to verify that, despite controlling for different factors, the class pay gap persists. In all regressions, the following specification is used:

Where  is the endogenous or dependent variable and represents the logarithm of the monthly work income of heads of households having prominent occupations (dominant class);
  is the independent variable of interest and denotes the social origin of the head of household, created from the highest education level attained by either of the parents of the head of household and operationalized as a binomial variable, which will have a value of 0 if any of the parents of the head of household completed higher education (privileged origin) and 1 otherwise (non-privileged origin). The magnitude of
  may be interpreted as the pay gap based on social origin.
  is a vector of explanatory variables that includes the educational background of the head of household: years of education, type of education center and prestige of the university attended; indicators of human capital: years of experience and total hours worked during the week, and labor context measures: size of company where works, type of occupation carried out and formality situation. In addition, the following variables are considered as demographic controls: age, sex, ethnic self-identification, maternal language, area of residence and whether or not lives in or outside of Lima.
  is the model’s error term.
On the other hand, to verify that educational background and, specifically, the type of university where one studied are substantive elements to explain the class pay gap, Oaxaca – Blinder decomposition of wage was used (Blinder, 1973). Although this decomposition does not represent a causal analysis, it allows us to estimate the part of the difference in a result variable between group A and group B is due to observable and non-observable characteristics (Castillo, 2011). In mathematical terms and within the context of the study problem, this may be expressed as follows:

Where  and
and  represent the expected value of the logarithm of the monthly labor income of heads of households of the dominant class of privileged and non-privileged origin, respectively. They are calculated by means of a linear regression where the independent variables correspond to the observable characteristics of the heads of households; on the other hand,
  denotes the class pay difference. In the study, a twofold Oaxaca – Blinder decomposition was used to decompose the wage difference . As a result of the procedure, an explained and unexplained dimension of the pay gap is obtained (Jann, 2008). The first dimension presents the explanatory contribution of each observable characteristic (such as the type of institution where higher education was completed) to the class pay gap. Similarly, to eliminate the selection bias from this procedure, a Heckman correction was performed. In general, this process consists of first estimating an equation of work participation for each of the groups that are compared in the Oaxaca – Blinder decomposition and including these results in the income equations that are estimated in the wage decomposition method (Zamora, 2013). The following variables were used in the workforce participation equation: number of children, years of education, and years of work experience. This and all statistical analyses were performed using the STATA 16 statistical package (StataCorp, 2019).
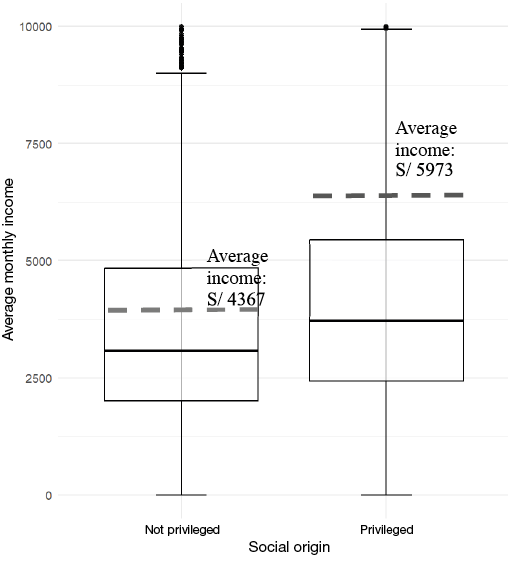
Figure 1 presents an initial approximation of the article’s main objectives. This shows that among the heads of households holding the most prominent occupations (the so-called dominant class) a wage difference exists based on the social origin of the individuals. The heads of households coming from a privileged background earn, on average, 1600 soles more than those from a non-privileged social background.
Although this marked disparity provides us with information about the relevance of social origin on future trajectory, it does not serve as a full justification for suggesting that the observed pay gap is solely due to social class. Other factors, such as gender, ethnic-racial differences, educational background, etc. may explain this income disparity.
To control for these differences, we analyze how the class pay gap changes when various sources of income inequality are considered. The results of this analysis are shown in Table 1, which presents a series of nested linear regressions that control for four sets that have been identified as drivers of wage disparities. The base model considers the main socio-demographics. Model 2 adds measures of educational background. Model 3 adds indicators of human capital. The last model adds measures on the work context. It should be noted that the choice of these income differentiators is based on the literature on pay gaps reviewed and detailed at the beginning of the document.
As seen in Table 1, even when controlling for all of these variables, the class pay gap persists for household heads from the dominant class. Specifically, in model 4, with all controls included, the coefficient associated with social origin is statistically significant5. According to this model, the heads of household of socially dominant positions coming from privileged social origins earned an average of 907 soles more than those coming from non-privileged social origins.
Model 4 presents the socio-demographic factors that are usually considered to be sources of the pay gap in studies on inequality: gender, regional differences and racial ethnicity; we can observe some relevant results. According to this model, gender is a statistically relevant variable for determining labor income. It is estimated that, when keeping all potential sources of inequality unchanged, the dominant class female heads of household receive an average monthly work income of 835 soles less than their male counterparts. In regional terms, when keeping the multiple origins of wage inequality unchanged, it is found that those living outside of Lima (or in the rural area) earn a significantly lower income than those residing in the capital department (or in the urban area). As for racial ethnicity, the ethnic characteristics are not found to be significant for understanding differences in income of the heads of household of the dominant class.
According to model 4, socio-demographic factors alone do not fully explain the wage differences arising in the dominant class. Educational background, such as the school and higher education establishment of origin (differentiated by the prestige of the university) are relevant elements for the analysis. Specifically, the place where the tertiary education was completed is found to be an especially important attribute. Heads of household from the dominant class who are educated at universities (public or private) considered prestigious earn significantly higher incomes than those coming from other institutions.
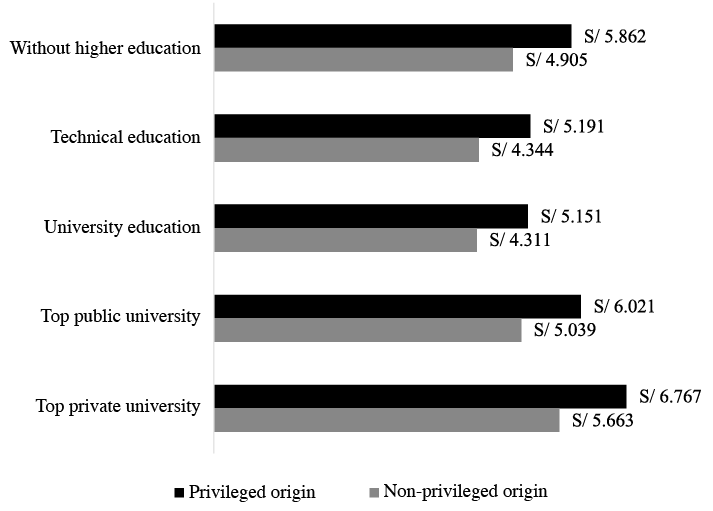
In order to detail how the university of origin is related to the class gap, monthly labor income is estimated according to the higher education center attended and social origin. The results of this calculation are presented in Figure 2, where it is shown that the pay gap of social origin remains, regardless of the higher education establishment attended. Although this pay gap narrows in the case of the most prestigious public and private universities6, it remains significant, with a difference of almost 980 soles for the former and 1100 soles for the latter. Thus, although the prestige of the university attended makes a substantial difference in terms of labor income, salary inequalities based on social origin persist. This suggests a discouraging panorama in terms of the equalizing potential of education.
In addition to education, model 4 reveals the existence of other indicators that explain the wage differences of the dominant class. This includes those linked to the so-called individual “human capital”7 such as work effort (measured in number of hours worked per week) or those showing the differences specific to each paid activity. In this last group, the formality of employment, the type of company where one works and the main occupation of the head of the household of the dominant class are all noteworthy.
In short, the analysis reveals that demographic conditions, educational background, individual human capital and job characteristics are all relevant to the understanding of the labor income of heads of households in the dominant class. It is shown that even when these factors remain constant, the social pay gap persists. This corroborates the first hypothesis of this study.
It is worth noting that, like the class gap, the gender pay gap remains, and both may be fueled by territorial differences. In this sense, the pay gaps present a scenario that is crossed by a pattern of accumulation of disadvantages. Another relevant point is the relevance of the location of the higher education completed and, especially, the reputation of the university attended in terms of salary. Individuals analyzed in the highlighted occupations who graduated from prestigious universities (especially from private ones) earn a higher income than those who attended other universities.
On the other hand, an Oaxaca – Blinder decomposition is used to analyze the degree to which the class pay gap is explained by observable characteristics of the heads of households of the dominant class. This statistical method permits the decomposition of the pay gap into two components, one that is explained and the other that is not explained (twofold decomposition). While the first reveals the degree to which the observable attributes (such as socio-demographics, education, human capital and work context) contribute to the class pay gap, the second provides us with the magnitude of differences based on unobservable factors.
Table 2 shows that the estimates from the Oaxaca – Blinder8 method determine that the class pay gap, S/ 1191 (= S/ 4411.7 – S/ 3220.7), represents 37 % of the average monthly income of the non-privileged heads of households (S/3220.7). While the first reveals the degree to which observable attributes (such as socio-demographics, education, human capital and work context) contribute to the class pay gap, the second provides us with the magnitude of differences based on unobservable factors. However, the remaining 19 % necessary for wage equalization between those moving upwards (from a non-privileged background) and those remaining stable on the social scale (from a privileged background) can only be achieved if the unobservable attributes do not exist or if, as the literature traditionally suggests, a situation of discrimination between these two groups does not continue.
The Oaxaca – Blinder decomposition also shows that, in general, the measurable and observable characteristics of the dominant class heads of households explain 44 % of the class pay gap. The remaining 56 % of the pay gap may be attributed to factors related to forms of class discrimination.
Among the measurable factors contributing to the explanation of the class pay gap, those related to education are the most relevant. In other words, if the educational background of those rising in social class were similar to that of those remaining stable in the dominant social class, the class pay gap would be reduced by 21 %. Specifically, the type of university completed is the educational characteristic found to be the most influential on the pay gap. If the heads of households from less privileged social backgrounds graduated from the same university as their counterparts from more privileged backgrounds, the class pay gap would be reduced by 14 %. These results allow for the verification of the second hypothesis of the study.
Living in Lima is another equally important element, which serves to the understanding of income discrepancies, as it results in a 14 % decrease in difference in monthly salaries between members of the dominant class from privileged and non-privileged backgrounds. Finally, the type of company where they work is relevant: if the compared groups worked in a company of the same size, the class pay gap would be reduced by 6 %.
Pay gaps have gained attention in the literature and beyond it, given their relevance to debates on meritocracy, privilege and discrimination. The results of this article suggest that this attention is essential in order to obtain a complete picture of how the reproduction of asymmetries operates.
To determine the magnitude of the class pay gap, we initially analyzed whether it may be neutralized by factors commonly associated with income differences. Gender is one of these factors that may exercise a major independent effect. In line with literature on gender inequality in the region, this study reveals that in the most prominent occupations, women’s wages are significantly lower than those of men. While other studies have found that the gender pay gap is sensitive to factors such as educational differences, industry, occupation and hours worked between women and men (Emerek, 2017; Hirsch, König and Möller, 2013; Ñopo, 2004), there is no potential control that can neutralize this gap.
Another factor that significantly affects income differences is the territory where the individual resides. The phenomenon of historical centralism in Peru (Contreras, 2000) is well-known, leading to the overrepresentation of the most prominent occupations in Lima: 61 % of the occupations performed by the dominant class are situated in the capital city, reaching 76 % for the case of company directors and managers (Rentería and Zárate, 2022). But this study reveals that it is also here where the highest incomes for these occupations are concentrated.
Education is also another factor that has a major impact on the magnitude of the class pay gap. As we have seen in both the regressions and the Oaxaca-Blinder decomposition, this means that not only do those from a privileged background and their counterparts reach a similar educational level, but the type of higher education institution that they attend is also fundamental (Sullivan et al., 2018; Zimmerman, 2019). As seen in Figure 2, graduates from top universities (even more so, private ones), obtain significantly higher pay than their counterparts who attended other higher education institutes of the country.
These results should be interpreted with consideration of other factors that characterize the Peruvian university system (Cuenca, Reátegui and Oré, 2019). Not only do those from less privileged social backgrounds have significantly fewer chances of accessing higher education, but the high segregation of institutions in terms of quality and costs may limit the possibilities of students graduating from less prestigious universities to access better jobs and pay. In other words, this limits their possibilities for social mobility (Benavides and Etesse, 2012; Benavides et al., 2015). In the case of Lima, distinct studies have shown that many of the leading companies recruit personnel from only a handful of elite private universities (Galarza, Kogan and Yamada, 2011; Kogan, Lay and Fuchs, 2013). If we consider that these universities, in turn, disproportionately admit students from the most privileged classes (Huber and Lamas, 2017; Reátegui, Grompone and Rentería, 2022), we find ourselves in a situation in which the educational institution in itself serves as a factor of inequality (Saraví, 2015).
As for ethnicity, it is striking that the variable of ethnic-racial self-identification is not significant. Although these results appear to be encouraging, caution should be taken when considering these measurements in the Latin American region and, especially, in the case of Peru. As Sulmont (2012) revealed, there are distinct means of measuring race and ethnicity in these contexts, with distinct results in terms of exclusion dynamics. While recent literature reveals an instability of the borders between supposed races, in many Latin American countries, these borders appear to be exceptionally porous, as evidenced by the logic of the “whitening” of the population through forms of social mobility (Cadena, 1995; Portocarrero, 2013; Kogan and Galarza, 2015).
But none of the factors typically associated with different forms of inequality or differences linked to the workplace neutralize the effect of social origin on the income of the dominant class. Although educational path, especially attendance at top universities, has been shown to significantly reduce the gap between those from a privileged social background and the rest, the results of this study suggest that this is insufficient to balance these differences. Huber and Lamas (2017) found that attending elite private universities serves as a mechanism of “social closure” between the middle and upper classes. This allows the graduates of these institutions to have a major advantage during the recruitment stage of the country’s main companies (Galarza, Kogan and Yamada, 2011). However, this study reveals that these advantages not only impact entry into companies and the most prominent positions in the labor market, but they also affect the trajectory in these areas, as evidenced by the class pay gap.
Although the statistical analysis from this article suggests that social origin acts as a powerful mechanism for reproducing economic differences in the dominant sectors, it does not provide us with elements to understand how, in practice, the privilege of origin determines difference in wages. Much of the literature on gender and ethnic-racial pay gaps attempts to spontaneously explain the pay gap as a product of discrimination. Although the literature indicates the persistence of different forms of discrimination in the workplace – some quite explicit, as shown Kogan, Lay and Fuchs, 2013 – this is insufficient to explain how privileged social origin helps promote the professional career path. Beyond segregation by gender, race or educational background in the recruitment process, there are other more subtle and possibly more powerful ways to capitalize on social background. We will devote these final words to mention some of these means of reproduction of asymmetries in order to serve as an incentive for future research.
One of the ways that privileged backgrounds serve as an advantage in professional environments is through cultural affinity between individuals of different ranks. As Rivera (2012) revealed, the recruitment process for high-profile jobs tends to extend beyond the assessment of skills: candidates are often appreciated for having cultural affinities with their employers and evaluators, in terms of leisure activities, experiences and styles of presentation. This cultural matching process is nourished by the familiarity experienced by individuals coming from the same social background: familiarity in both the sense of ease in dealing with others and in their reluctance to return to their family of origin (Bourdieu, 2015: 40). This affinity not only provides advantages in access to companies and institutions, but it also gives those from a privileged social background an advantage throughout their academic and professional career, disguising knowledge and practical expertise acquired in exclusive social circles as so-called “soft skills” (Reátegui, Grompone and Rentería, 2022; Rentería, Grompone and Reátegui, 2020).
According to Friedman and Laurison (2019), while only a few people tend to feel comfortable in prominent environments, cultural coincidence provides greater opportunities for those from privileged backgrounds to display a ‘sense of self-entitlement’. This is especially beneficial for career success. The counterpart of this process is that often times, their less privileged peers choose to exclude themselves from better job opportunities as a protective measure against the possibility of not fitting into prominent environments. Rather than open forms of discrimination and exclusion, these studies reveal that, in order to discover the causes of the class pay gap, it is necessary to understand the organizational cultures of the different professional environments in which the dominant class circulates. This means delving into the aspirations, strategies and practical logic underlying the trajectory of individuals from distinct social origins in the most prominent professional circuits of the country. Only in this way can we fully understand how social origin may leave a permanent mark.
Álvarez, María (2019). “¿Los becados con los becados y los ricos con los ricos? Interacciones entre clases sociales distintas en una universidad de elite”. Desacatos, 59: 50-67.
Anghel, Brindusa; Conde-Ruiz, José and Artíñano, Ignacio de (2019). “Brechas salariales de género en España”. Hacienda Pública Española, 229: 87-119.
Arias, Omar; Yamada, Gustavo and Tejerina, Luis (2004). “Education, Family Background and Racial Earnings Inequality in Brazil”. International Journal of Manpower, 25(3/4): 355-374.
Atkinson, Will (2017). Class in the New Millennium. The Structure, Homologies and Experience of the British Social Space. Oxon and New York: Routledge.
Benavides, Martín (2004). Educación y estructura social en el Perú. Un estudio acerca del acceso a la educación superior y la movilidad intergeneracional en una muestra de trabajadores urbanos. In: P. Arregui et al. (eds.). ¿Es posible mejorar la educación peruana?: Evidencias y posibilidades. Lima: GRADE.
Benavides, Martín and Etesse, Manuel (2012). Movilidad educativa intergeneracional, educación superior y movilidad social en el Perú: evidencias recientes a partir de encuestas de hogares. In: R. Cuenca (ed.). Educación superior, movilidad social e identidad. Lima: IEP.
Benavides, Martín; León, Juan; Haag, Frida and Cueva, Selene (2015). Expansión y diversificación de la educación superior universitaria y su relación con la desigualdad y segregación. Available at: http://www.grade.org.pe/wp-content/uploads/ddt78.pdf, access January 7, 2024.
Bergman, Manfred and Joye, Dominique (2005). “Comparing Social Stratification Schemata: CAMSIS, CSP-CH, Goldthorpe, ISCO-88, Treiman, and Wright”. Cambridge studies in social research, 10: 1-35.
Bernardi, Fabrizio and Ares, Macarena (2017). Education as the (Not So) Great Equalizer: New Evidence Based on a Parental Fixed Effect Analysis for Spain. EUI Working Papers SPS 2017/6.
Black, Sandra and Deveraux, Paul (2010). Recent Developments in Intergenerational Mobility. IZA Discussion Paper No. 4866. Available at: http://ftp.iza.org/dp4866.pdf, access January 2, 2024.
Blinder, Alan (1973). “Wage Discrimination: Reduced Form and Structural Estimates”. Journal of Human Resources, 8(4): 436 - 455.
Bourdieu, Pierre (2015). La nobleza del estado. Educación de élite y espíritu de cuerpo. Buenos Aires: Siglo XXI Editores.
Bourdieu, Pierre and Passeron, Jean-C. (2009). Los herederos. Los estudiantes y la cultura. Buenos Aires: Siglo XXI Editores.
Bukodi, Erzsébet and Goldthorpe, John H. (2013). “Decomposing ‘Social Origins’: The Effects of Parents’ Class, Status, and Education on the Educational Attainment of their Children”. European Sociological Review, 29(5): 1024–1039. doi: 10.1093/esr/jcs079
Cadena, Marisol de la (1995). “Women Are More Indian”: Ethnicity and Gender in a Community near Cuzco. In: B. Larson; O. Harris and E. Tandeter (eds.). Ethnicity, Markets, and Migration in the Andes. New York: Duke University Press.
Carabaña, Julio and Fuente, Gloria de la (2015). “Facultad por Facultad. Origen familiar y empleo de los licenciados en CCSS y Humanidades de la UCM en el año 2003”. Revista Complutense de Educación, 26(3): 983-1001.
Castillo, Wilberth (2011). Discriminación salarial por género en el Perú: 2003 - 2009. Villena, Benjamin (dir.), Santiago de Chile: Universidad de Chile. [Master’s Thesis].
Clark, Damon and Bono, Emilia del (2016). “The Long-Run Effects of Attending an Elite School: Evidence from the United Kingdom”. American Economic Journal: Applied Economics, 8(1): 150-176.
Contreras, Carlos (2000). Centralismo y descentralismo en la historia del Perú independiente. Available at: https://repositorio.iep.org.pe/handle/IEP/625, access December 26, 2023.
Cuenca, Ricardo; Reátegui, Luciana and Oré, Sarita (2019). “Itinerarios de la educación privada en el Perú”. Educação e Sociedade, 40: 1-16.
Emerek, Ruth (2017). “Intersectionality - an Intercategorical Empirical Apporach”. Kvinder, Køn and Forskning, 1: 18-31.
Estrada, Ricardo and Gignoux, Jéremie (2017). “Benefits to Elite Schools and the Expected Returns to Education: Evidence from Mexico City”. European Economic Review, 95: 168-194.
Fachelli, Sandra; Torrents, Dani and Navarro-Cendejas, José (2014). “¿La universidad española suaviza las diferencias de clase en la inserción laboral?”. Revista de Educación, 364: 119-144.
Fang, Ray T. and Tilcsik, András (2022). “Prosocial Occupations, Work Autonomy, and the Origins of the Social Class Pay Gap”. Academy of Management Journal, 65(3): 903-929.
Friedman, Sam and Laurison, Daniel (2017). “Mind the Gap: Financial London and the Regional Class Pay Gap”. British Journal of Sociology, 68(3): 474-511.
Friedman, Sam and Laurison, Daniel (2019). The Class Ceiling. Why it Pays to be Priviledged. Bristol and Chicago: Policy Press.
Kogan, Luiba and Galarza, Francisco (2015). Cuando la piel habla: Estrategias de blanqueamiento en el sistema universitario peruano. Available at: http://hdl.handle.net/11354/966, access December 20, 2023.
Galarza, Francisco; Kogan, Liuba and Yamada, Gustavo (2011). ¿Existe discriminación en el mercado laboral de Lima Metropolitana? un análisis experimental. Available at: https://repositorio.up.edu.pe/handle/11354/375, access December 20, 2023.
Gregg, Paul; Jonsson, Jan O.; Macmillan, Lindsey and Mood, Carina (2017). “The Role of Education for Intergenerational Income Mobility: A Comparison of the United States, Great Britain, and Sweden”. Social Forces, 96(1): 121-152.
Hall, Gillete and Patrinos, Harry A. (2012). Latin America. In: G. Hall and H. Patrinos (eds.). Indigenous Peoples, Poverty, and Development. New York: Cambridge University Press.
Hansen, Marianne N.; Flemmen, Magne and Andersen, Patrick (2009). Oslo Register Data Class Scheme (ORDC), Final report from the classification project. Oslo: University of Oslo.
Hirsch, Boris; König, Marion and Möller, Joachim (2013). “Is There a Gap in the Gap? Regional Differences in the Gender Pay Gap”. Scottish Journal of Political Economy, 60(4): 412-439.
Huber, Ludwig and Lamas, Leonor (2017). Deconstruyendo el rombo. Consideraciones sobre la nueva clase media en el Perú. Lima: IEP.
Jann, Ben (2008). “The Blinder–Oaxaca Decomposition for Linear Regression Models”. The Stata Journal, 8(4): 453-479.
Kogan, Liuba; Lay, Patricia and Fuchs, Rosa M. (2013). No pero sí. Discriminación de empresas en Lima Metropolitana. Lima: Universidad del Pacífico.
Laurison, Daniel and Friedman, Sam (2016). “The Class Pay Gap in Higher Professional and Managerial Occupations”. American Sociological Review, 81(4): 668-695.
Marteleto, Leticia and Andrade, Fernando (2014). “The Educational Achievement of Brazilian Adolescents: Cultural Capital and the Interaction between Families and Schools”. Sociology of Education, 87(1): 16-35.
Neidhöfer, Guido; Serrano, Joaquín and Gasparini, Leonardo (2018). “Educational inequality and intergenerational mobility in Latin America: A new database”. Journal of Development Economics, 134: 329-349.
Ñopo, Hugo (2004). “The Gender Wage Gap in Peru 1986-2000: Evidence From a Matching Comparisons Approach”. Económica, L(1–2): 9-37.
Ñopo, Hugo (2012). New Century, Old Disparities. Gender and Ethnic Earnings Gaps in Latin America and the Caribbean. New York: Inter-American Development Bank.
Ñopo, Hugo, Saavedra, Jaime and Torero, Maximo (2004). Ethnicity and Earnings in Urban Peru. IZA Discussion Paper No. 980.
Núñez, Janier and Gutiérrez, Roberto (2004). “Class Discrimination and Meritocracy in the Labor Market: Evidence from Chile”. Estudios de Economía, 31(2): 113-132.
Ortiz-Ospina, Esteban; Hasell, Joe and Roser, Max (2018). Economic Inequality by Gender. Available at: https://ourworldindata.org/economic-inequality-by-gender
Perticará, Marcela and Tejada, Mauricio (2021). “Sources of Gender Wage Gaps for Skilled Workers in Latin American Countries”. Journal of Economic Inequality, 20: 439-463.
Piovani, Juan I. and Salvia, Agustín (2018). La Argentina en el siglo XXI. Cómo somos, vivimos y convivimos en una sociedad desigual. Buenos Aires: Siglo XXI Editores.
Polachek, Salomon W. and Xiang, Jun (2021). The Gender Pay Gap Across Countries: A Human Capital Approach. IZA Discussion Paper No. 8603.
Portocarrero, Gonzalo (2013). La utopÍa del blanqueamiento y la lucha por el mestizaje. In: CLACSO (ed.). Hegemonía cultural y políticas de la diferencia. Buenos Aires: CLACSO.
Psacharopoulos, George and Tzannatos, Zafiris (1992). Latin American Women’s Earnings and Participation in the Labor Force. Policy Research Working Paper Series No. 856.
Reátegui, Luciana, Grompone, Alvaro and Rentería, Mauricio (2022). ¿De qué colegio eres? La reproducción de la clase alta en el Perú. Lima: IEP.
Rentería, Mauricio; Grompone, Alvaro and Reátegui, Luciana (2020). “Educados en el privilegio: trayectorias educativas y reproducción de las élites en Perú”. Revista Española de Sociologia, 29(3): 561-578.
Rentería, Mauricio and Zárate, Patricia (2022). La distinción silenciosa. Clases y divisiones simbólicas en el Perú. Lima: IEP.
Rivera, Lauren A. (2012). “Hiring as Cultural Matching: The Case of Elite Professional Service Firms”. American Sociological Review, 77(6): 999-1022.
Rubery, Jill and Hebson, Gail (2018). “Applying a Gender Lens to Employment Relations: Revitalisation, Resistance and Risks”. Journal of Industrial Relations, 60(3): 414-436.
Saraví, Gonzalo (2015). Juventudes fragmentadas. Socialización, clase y cultura en la construcción de la desigualdad. México D. F.: Flacso México, CIESAS.
Scarpetta, Nathalia (2020). Aproximación a la discriminación racial en Cali: ¿se asignan salarios por color de piel? Universidad de los Andes, Documento de trabajo No. 72.
StataCorp (2019). Stata Statistical Software. College Station, TX: StataCorp LLC.
Sullivan, Alice; Parsons, Samantha; Green, Francis; Wiggins, Richard D. and Ploubidis, George (2018). “Elite Universities, Fields of Study and Top Salaries: Which Degree will Make you Rich?”. British Educational Research Journal, 44(4): 663-680.
Sulmont, Denis (2012). Raza y etnicidad desde las encuestas sociales y de opinión: dime cuántos quieres encontrar y te diré qué preguntar... In: C. Sanborn (ed.). La discriminación en el Perú: balance y desafíos. Lima: Universidad del Pacífico.
Toro, Harold J. (2021). “Minding the Curve: The Influence of Social Origin on Earnings Inequality by Education in Mexico”. British Journal of Sociology, 72(5): 1394-1414.
Willis, Paul (1977). Learning to Labor. How Working Class Kids Get Working Class Jobs. New York: Columbia University Press.
Zamora, José (2013). Determinación del posible sesgo de selección en pruebas mediante la metodología de Heckman. Costa Rica: Instituto Tecnológico de Costa Rica.
Zimmerman, Seth D. (2019). “Elite Colleges and Upward Mobility to Top Jobs and Top Incomes”. American Economic Review, 109(1): 1-47.
Table A1. Descriptive statistics of the sample
|
Variables |
Total sample (N=5612) |
Privileged origin (N=1684) |
Non-privileged origin (N=2504) |
|
Monthly work income (average) |
5261.38 |
5972.74 |
4366.84 |
|
Socio-demographics |
|
||
|
Sex (%) |
|
||
|
Male |
80.96 % |
78.95 % |
83.70 % |
|
Female |
19.04 % |
21.05 % |
16.30 % |
|
Age (%) |
|
||
|
25 to 34 |
14.07 % |
20.44 % |
12.37 % |
|
35 to 44 |
24.66 % |
30.67 % |
21.59 % |
|
45 to 54 |
31.76 % |
29.91 % |
31.58 % |
|
55 to 65 |
29.51 % |
18.98 % |
34.46 % |
|
Marital status (%) |
|
||
|
No spouse |
28.88 % |
30.98 % |
28.00 % |
|
With spouse |
71.12 % |
69.02 % |
72.00 % |
|
Ethnic self-identification (%) |
|
||
|
Mestizo |
74.80 % |
75.80 % |
71.87 % |
|
Indigenous |
12.80 % |
11.75 % |
18.27 % |
|
White |
5.52 % |
5.85 % |
3.90 % |
|
Afro-Peruvian |
1.69 % |
1.44 % |
2.28 % |
|
Other/unknown |
5.19 % |
5.15 % |
3.68 % |
|
Maternal language (%) |
|
|
|
|
Spanish |
94.61 % |
97.32 % |
94.54 % |
|
Indigenous language |
4.95 % |
2.02 % |
9.18 % |
|
Foreign language |
0.40 % |
0.66 % |
0.18 % |
|
Deaf |
0.04 % |
0.00 % |
0.11 % |
|
Area of residence (%) |
|
||
|
Urban |
99.03 % |
99.41 % |
98.24 % |
|
Rural |
0.97 % |
0.59 % |
1.76 % |
|
Residence in the capital department (%) |
|
||
|
Lives in the Lima department |
38.40 % |
39.84 % |
59.53 % |
|
Lives outside of the Lima department |
61.60 % |
60.16 % |
40.47 % |
|
Educational measures |
|
||
|
Years of education (average) |
19.4 |
19.61 |
19.31 |
|
Type of education center (%) |
|
||
|
State |
48.92 % |
44.47 % |
56.69 % |
|
Private |
51.08 % |
55.53 % |
43.31 % |
|
Type of university (%) |
|
|
|
|
No higher education |
9.09 % |
3.40 % |
3.48 % |
|
Technical education |
4.67 % |
4.65 % |
4.41 % |
|
University education |
55.52 % |
24.54 % |
8.92 % |
|
Top private university |
18.82 % |
55.66 % |
72.91 % |
|
Top public university |
11.90 % |
11.75 % |
10.27 % |
|
Human capital measures |
|
||
|
Weekly hours worked (average) |
40.5 |
40.82 |
39.39 |
|
Work experience (average) |
10.1 |
8.71 |
11.1 |
|
Employment |
|
|
|
|
Informality status (%) |
|
||
|
Informal employment |
13.41 % |
12.94 % |
15.92 % |
|
Formal employment |
86.59 % |
87.06 % |
84.08 % |
|
Company size (%) |
|
||
|
Microenterprise |
33.29 % |
33.22 % |
37.00 % |
|
Small business |
15.06 % |
15.33 % |
11.26 % |
|
Middle and large business |
51.44 % |
51.37 % |
51.60 % |
|
Not specified |
0.21 % |
0.08 % |
0.14 % |
|
Occupation (%) |
|
||
|
Economic elite |
9.52 % |
9.59 % |
9.23 % |
|
Finance professionals |
12.90 % |
12.02 % |
12.82 % |
|
High level professionals |
58.03 % |
57.89 % |
55.90 % |
|
Cultural elite |
19.36 % |
20.46 % |
21.76 % |
|
Technicians |
0.19 % |
0.05 % |
0.28 % |
Note: A total of 1424 household heads in the sample did not respond to the question about their parents' educational level; therefore, their social origin could not be determined.
Source: Author’s own creation.
Table A2. List of prestigious private and public universities
|
Top private universities |
|
Pontificia Universidad Católica del Perú |
|
Universidad Científica del Sur |
|
Universidad de Ciencias y Artes de América Latina |
|
Universidad de Lima |
|
Universidad de Piura |
|
Universidad de San Martín de Porres |
|
Universidad del Pacífico |
|
Universidad ESAN |
|
Universidad Peruana Cayetano Heredia |
|
Universidad Peruana de Ciencias Aplicadas |
|
Universidad Ricardo Palma |
|
Top public universities |
|
Universidad Nacional Agraria La Molina |
|
Universidad Nacional de Ingeniería |
|
Universidad Nacional Mayor de San Marcos |
Source: Author’s own creation.
Figure A1. Class pay gap according to different social origin measurement strategies
Source: Author’s own creation.
Table A3. Variance inflation factors (VIF) of Model 4 from Table 1
|
Variables |
VIF |
|
Non-privileged origin |
1.17 |
|
Sex |
1.46 |
|
Age |
84.37 |
|
Age (squared) |
84.73 |
|
With spouse |
1.45 |
|
Ethnic self-identification |
|
|
Indigenous |
3.98 |
|
Afro-Peruvian |
1.4 |
|
Mestizo |
3.95 |
|
Maternal language |
|
|
Indigenous language |
1.25 |
|
Foreign language |
1.05 |
|
Rural |
1.04 |
|
Lives in the department of Lima |
1.52 |
|
Years of education |
1.58 |
|
Private school |
1.38 |
|
Type of university |
|
|
Without higher education |
1.4 |
|
Technical education |
1.22 |
|
Top private university |
1.53 |
|
Top public university |
1.34 |
|
Work experience |
11.32 |
|
Work experience (squared) |
10.86 |
|
Hours worked per week |
1.05 |
|
Occupation |
|
|
Economic elite |
1.16 |
|
Finance professionals |
1.24 |
|
Cultural elite |
1.22 |
|
Technicians |
1.06 |
|
Informal employment |
1.14 |
|
Company size |
|
|
Small company |
1.25 |
|
Middle and large sized company |
1.37 |
|
Average VIF |
8.12 |
Source: Author’s own creation.
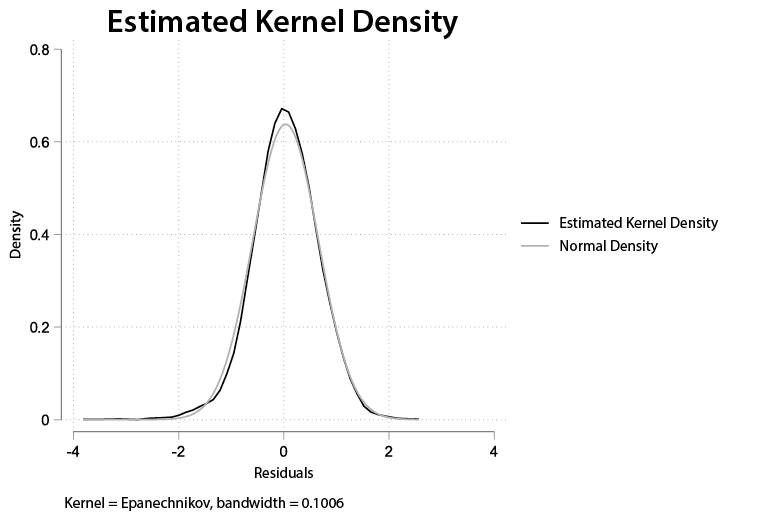
Figure A2. Kernel density estimated from the residuals of model 4 of Table 1
Source: Author’s own creation.
1 This study measures the cultural capital of students based on an index composed of the possession of art works and the number of literature books (Marteleto and Andrade, 2014: 21).
2 This survey is a statistical source traditionally used to obtain sociodemographic and economic information from Peruvian households. The survey sample is probabilistic, area-based, stratified, multi-stage and independent in each area of study. It is representative at the departmental and national levels, as well as at the urban and rural levels.
3 Information on the educational achievement of the father and mother of the head of the household is collected through the question: What was the level of education attained by your father (mother)?, having the following response options: no educational level, incomplete primary, complete primary, incomplete secondary, complete secondary, incomplete non-university higher education, complete non-university higher education, incomplete university higher education and complete university higher education.
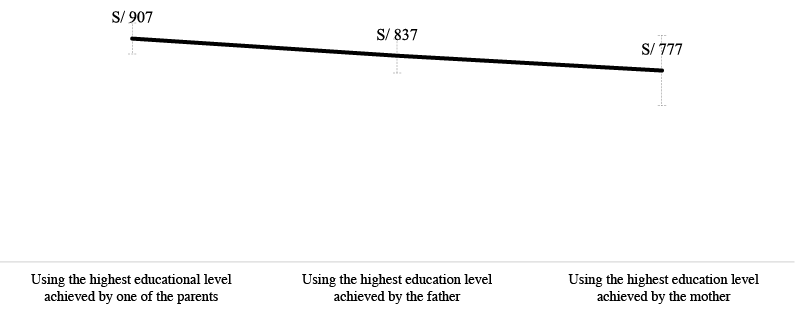
4 Furthermore, there is no concern over this procedure biasing the final results since, by performing two trials of this process, the first with only the father's information and the second with only the mother's information, and completing the proposed methodology, statistically similar estimates of the class pay gap are obtained (see Figure A1).
5 This model meets the basic assumptions of a multiple linear regression model. Multicollinearity is low. The variance inflation factors (VIF) of the independent variables are mostly less than 10, and the average VIF of the model is 8.12 (see Table A3). The problem of heteroscedasticity of the model residuals is corrected by robustly estimating the error variance and covariance matrix. The residuals follow a normal distribution (See Figure A2).
6 To review the list of private and public universities considered prestigious, see Table A2 of the Annex.
7 Another indicator of human capital that is considered in the regressions is that of work experience (operationalized by the years of work in the main occupation). However, it is not statistically significant.
8 For the calculation of the Oaxaca – Blinder decomposition, the same regressors from model 4 of Table 1 were considered.